
Quality Control (QC), Production Management, and Equipment Maintenance
品質管理・生産管理・設備保全
Industrial Manufacturing (SSW 2) · 製造分野(2号) · Written by Tokutei Pass based on the official study texts; not copied verbatim.
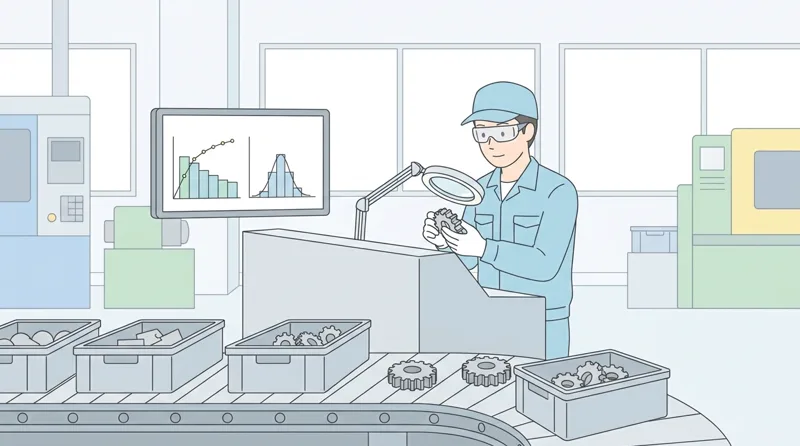
QC七つ道具(パレート図・特性要因図・ヒストグラム・散布図・管理図)
QC Seven Tools (Pareto Chart, Fishbone Diagram, Histogram, Scatter Plot, Control Chart)
「パレート図」は不良項目を件数順の棒グラフと累積比率の折れ線グラフで表し、最優先で対策すべき重点課題を見つける図です。
A 'Pareto chart' combines descending bars of defect counts with a cumulative percentage line to identify the vital few priority issues.
「特性要因図(魚の骨図)」は結果(特性)に対して4M(人・機械・材料・方法)などの原因を整理し、「なぜなぜ分析」で真因を究明します。
A 'Cause-and-Effect diagram' (fishbone diagram) organizes causal factors (such as 4M: Man, Machine, Material, Method) against an outcome, while 'Why-Why analysis' finds the root cause.
「ヒストグラム」は測定値のばらつき(中心や分布形状)を表し、「散布図」は2つの対になったデータ(温度と寸法など)の相関関係を調べます。
A 'Histogram' shows the distribution and spread of measured data, and a 'Scatter diagram' examines the correlation between two paired variables.
「管理図」は中心線(CL)と上方・下方管理限界線(UCL・LCL、通常±3σ)を引き、点の並びから異常原因による工程変化を検出します。
A 'Control chart' uses a center line (CL) and upper/lower control limits (UCL/LCL, typically ±3σ) to detect process abnormalities over time.
Key points
- 【○正しい】重点課題の特定には「パレート図」、要因の整理には「特性要因図」、2変数の相関には「散布図」を使う。
(○ True) Use a Pareto chart to prioritize problems, a fishbone diagram to organize causes, and a scatter plot to check correlation between two variables. - 【○正しい】管理図では、点が管理限界線(UCL・LCL)の内側にあっても中心線の片側に連続して並ぶなどのクセがあれば異常と判定する。
(○ True) On a control chart, non-random runs or trends (such as many consecutive points on one side of the center line) indicate process abnormality even inside UCL/LCL. - 【×誤り】管理限界線(UCL・LCL)を「製品図面の寸法公差(規格限界)とまったく同じ線」というのは誤り。
(× False) Saying control limits (UCL/LCL) are identical to product drawing specification limits (tolerances) is FALSE.
| Word | Meaning |
|---|---|
| パレート図 | Pareto chart |
| 特性要因図 | cause-and-effect (fishbone) diagram |
| ヒストグラム | histogram |
| 散布図 | scatter diagram |
| 管理図 | control chart |
PDCAサイクル・工程能力指数(Cp)と検査方式
PDCA Cycle, Process Capability Index (Cp), and Inspection Methods
業務改善の「PDCAサイクル」は、Plan(計画)→Do(実行)→Check(評価・確認)→Act(改善・処置)の順に回して継続的に水準を高めます。
The continuous improvement 'PDCA cycle' progresses through Plan -> Do -> Check -> Act.
工程能力指数 $C_p$=(上側規格限界-下側規格限界)$\div 6\sigma$ はばらつきの余裕を表し、一般に $C_p \ge 1.33$ で工程能力が十分と判断します。
The process capability index $C_p = \frac{\text{USL} - \text{LSL}}{6\sigma}$ compares tolerance width against process spread ($6\sigma$); generally, $C_p \ge 1.33$ indicates sufficient capability.
生産開始時や段取り替え直後に最初の加工品を測る「初品検査」や、ロットから無作為に試料を選ぶ「抜取検査」(破壊検査にも不可欠)を使い分けます。
'First-article inspection' checks the initial piece after setup or changeover, while 'sampling inspection' randomly selects samples from a lot (and is essential for destructive testing).
品質は最後の検査だけで選別するのではなく、「品質は工程で造り込む」ことと「後工程はお客様(不良を受け取らない・造らない・流さない)」が基本です。
Rather than relying solely on final sorting, 'quality must be built into the process' under the principle that 'the next process is your customer' (do not accept, make, or pass on defects).
Key points
- 【○正しい】PDCAは「計画→実行→評価→改善」の順に回し、工程能力指数は $C_p「規格幅$\div 6\sigma$」 で計算する。
(○ True) PDCA follows 'Plan -> Do -> Check -> Act', and the process capability index is calculated as $C_p = (\text{Specification width}) \div (6\sigma)$. - 【○正しい】破壊試験では全数検査ができないため無作為抽出による「抜取検査」を行い、段取り替え直後には「初品検査」を行う。
(○ True) Destructive testing requires random 'sampling inspection' rather than 100% inspection, and 'first-article inspection' is performed right after setup changes. - 【×誤り】「最後に出荷検査さえすれば途中工程で不良を次工程へ流してもよい」というのは誤り。
(× False) Saying 'as long as final shipping inspection is done, intermediate processes may pass defects to the next process' is FALSE.
| Word | Meaning |
|---|---|
| PDCAサイクル | PDCA cycle |
| 工程能力指数 | process capability index (Cp) |
| 初品検査 | first-article inspection |
| 抜取検査 | sampling inspection |
| 標準作業書 | standard operating procedure (SOP) |
生産管理(JIT・かんばん・ボトルネック・稼働率・リードタイム・先入先出)
Production Management (JIT, Kanban, Bottleneck, Availability, Lead Time, FIFO)
ジャストインタイム(JIT)生産では、「必要なものを、必要なときに、必要な量だけ」生産し、「かんばん」を使って後工程が前工程から引き取る方式でつくりすぎのムダを防ぎます。
Just-In-Time (JIT) production makes 'only what is needed, when needed, in the amount needed', using 'Kanban' pull signals from downstream processes to prevent overproduction waste.
ライン全体の生産能力は最もサイクルタイムが長い(能力が低い)「ボトルネック工程」で決まるため、全体の生産量を増やすにはボトルネックを改善します。
Total line output is governed by the slowest stage—the 'bottleneck process' (longest cycle time)—so improving line capacity requires improving the bottleneck.
発注や投入から完成・納品までの期間を「リードタイム」、部品の入出庫で古いものから順に使う管理を「先入れ先出し(FIFO)」といいます。
The elapsed time from order/material input to completion is 'lead time', and using older inventory lots first is 'First-In, First-Out' (FIFO).
不良率は「不良個数÷検査総数×100(%)」、設備の稼働率は「実稼働時間÷負荷時間×100(%)」で計算します。
Defect rate equals 'defective units ÷ total inspected units × 100 (%)', and equipment availability equals 'actual operating time ÷ planned loading time × 100 (%)'.
Key points
- 【○正しい】JIT生産では後工程引取方式(かんばん方式)により「つくりすぎのムダ」や仕掛在庫を減らす。
(○ True) JIT production uses downstream pull (Kanban) to eliminate overproduction waste and reduce work-in-process inventory. - 【○正しい】ラインの生産能力は最もサイクルタイムが長い「ボトルネック工程」で決まり、在庫管理では「先入れ先出し(FIFO)」を徹底する。
(○ True) Line capacity is limited by the slowest 'bottleneck process', and inventory is managed by 'First-In, First-Out' (FIFO). - 【×誤り】ボトルネック工程を放置して前工程だけ速度を上げると、中間仕掛品(在庫)がたまるだけで完成品は増えない。
(× False) Speeding up only upstream processes while ignoring the bottleneck merely piles up work-in-process without increasing finished output.
| Word | Meaning |
|---|---|
| ジャストインタイム(JIT) | Just-In-Time (JIT) |
| かんばん方式 | Kanban system |
| ボトルネック工程 | bottleneck process |
| リードタイム | lead time |
| 先入れ先出し | First-In, First-Out (FIFO) |
設備保全(予防保全・予知保全・事後保全・自主保全)とトレーサビリティ
Equipment Maintenance (Preventive, Predictive, Corrective, Autonomous) and Traceability
故障する前に一定期間・使用時間ごとに定期点検や部品交換を行う方法を「予防保全」、故障後に修理するのを「事後保全」といいます。
Performing scheduled inspections and part replacements before failure is 'Preventive Maintenance', whereas repairing after breakdown is 'Corrective (Breakdown) Maintenance'.
振動・温度・異音などをセンサーなどにより連続監視して劣化兆候から故障時期を予測する「予知保全」や、オペレーター自身が日常清掃・給油・点検を行う「自主保全」も重要です。
Monitoring vibration, temperature, or noise trends to predict failure is 'Predictive Maintenance', and daily cleaning, lubrication, and inspection by operators is 'Autonomous Maintenance'.
設備の「チョコ停」とは、センサー検知やワーク詰まりなどで一時的に短時間停止する現象で、放置すると稼働率低下や安全事故につながります。
'Minor stops' (Chokotei) are brief, frequent interruptions caused by part jams or sensor trips that reduce availability and pose safety risks if handled improperly.
製品のロット番号から原材料・加工日時・設備・検査履歴を追跡できる仕組みを「トレーサビリティ(追跡可能性)」といい、不良発生時の対象範囲特定に不可欠です。
Tracking raw materials, machining dates, equipment, and inspection records via lot numbers is called 'Traceability', enabling rapid containment if defects occur.
Key points
- 【○正しい】定期的に点検・部品交換して故障を防ぐのは「予防保全」、劣化状態を診断して交換時期を決めるのは「予知保全」である。
(○ True) Scheduled inspection and part replacement before failure is 'preventive maintenance', while diagnosing degradation trends is 'predictive maintenance'. - 【○正しい】製造履歴や材料ロットを追跡できる仕組みを「トレーサビリティ」といい、不良発生時の影響範囲特定に役立つ。
(○ True) Tracking production history and material lots is called 'traceability', which helps isolate affected lots when defects arise. - 【×誤り】「設備は壊れてから修理すればよいので日常点検や給油は一切不要である」というのは誤り。
(× False) Saying 'machines only need repair after breaking down, so daily inspection and lubrication are unnecessary' is FALSE.
| Word | Meaning |
|---|---|
| 予防保全 | preventive maintenance |
| 予知保全 | predictive maintenance |
| 自主保全 | autonomous maintenance |
| チョコ停 | minor stoppage (Chokotei) |
| トレーサビリティ | traceability |
Quality Control and QC Tools
Practice this chapter in the appOfficial references
- 製造分野特定技能2号評価試験(経済産業省・JAIM) — https://www.jaim-skill.or.jp/exam/about-ssw2/
- 製造分野特定技能評価試験 試験基準(別紙) — https://www.jaim-skill.or.jp/assets/files/exam/top/exam_criteria.pdf