 Tokutei Pass
Quality Control and Inspection
品質管理・検査
Industrial Manufacturing - Machinery and Electronics · 製造分野 · Written by Tokutei Pass based on the official study texts; not copied verbatim.
職場の5S活動と報連相・作業手順書
Workplace 5S, Hou-Ren-Sou, and Standard Operating Procedures
職場の5Sとは、「整理・整頓・清掃・清潔・しつけ」の5つの活動のことです。
Workplace 5S consists of five activities: Sort (Seiri), Set in order (Seiton), Shine (Seisou), Standardize (Seiketsu), and Sustain (Shitsuke).
「整頓」は工具などの保管場所を決めてすぐ取り出せるようにし元に戻すこと、「清掃」はゴミや油汚れを掃除してきれいにすることです。
'Set in order' (Seiton) means deciding storage locations for tools and returning them after use, while 'Shine' (Seisou) means cleaning away trash and oil.
職場で大切な「報連相」とは、「報告・連絡・相談」の行動のことです。
'Hou-Ren-Sou' in the workplace stands for Reporting (Houkoku), Communicating (Renraku), and Consulting (Soudan).
作業手順書(標準作業)は品質と安全を一定に保つための基準であり、仕事に慣れても省略せず必ず守ります。
Standard Operating Procedures (work manuals) maintain consistent quality and safety; even experienced workers must never skip steps.
Key points
- 【○正しい】職場の5Sは「整理・整頓・清掃・清潔・しつけ」、報連相は「報告・連絡・相談」である。
(○ True) Workplace 5S stands for 'Seiri, Seiton, Seisou, Seiketsu, Shitsuke', and Hou-Ren-Sou stands for 'Report, Communicate, Consult'. - 【×誤り】機械の周りのゴミや油汚れを掃除することを「整頓」というのは誤り(掃除は「清掃」、置き場所を決めるのが「整頓」)。
(× False) Saying 'Seiton (Set in order)' means sweeping trash and oil around machines is FALSE (cleaning is 'Seisou'; organizing tool locations is 'Seiton'). - 【×誤り】作業手順書(標準作業)は新入社員だけのもので慣れたら省略してよいというのは誤り。
(× False) Saying work procedure manuals are only for new hires and may be skipped once accustomed is FALSE.
| Word | Meaning |
|---|---|
| 整理・整頓 | Sort and Set in order (Seiri - Seiton) |
| 清掃・清潔 | Shine and Standardize (Seisou - Seiketsu) |
| 報連相 | Report, Communicate, Consult (Hou-Ren-Sou) |
| 作業手順書 | work procedure manual (SOP) |
| 標準作業 | standard operation |
品質のつくり込みと初品検査・異常時対応
Building In Quality, First-Article Inspection, and Abnormality Response
「後工程はお客様」という考え方では、自工程で品質をつくり込み、不良品を絶対に次の工程へ流しません。
Under the principle 'the next process is the customer', quality is built into each process and defective items are never passed downstream.
段取り替えの後、最初にできた製品を検査する(初品検査)のは、設定や加工条件が正しいか確認し不良の大量発生を防ぐためです。
Inspecting the first product after a changeover (first-article inspection) verifies correct setup and machining conditions to prevent mass defects.
検査で不良品を発見したときは、上司に報告し、不良品を識別して良品と分け、指示に従います。
When a defective product is found during inspection, report to your supervisor, label and separate it from good products, and follow instructions.
作業中に機械からいつもと違う異常な音がしたときは、安全を確認して機械を止め、上司や保全担当者に報告します。
If a machine makes an unusual noise during operation, ensure safety, stop the machine immediately, and report to your supervisor or maintenance staff.
Key points
- 【×誤り】「後工程はお客様」なのに、次の検査で見つかるからと不良をそのまま流してよいというのは誤り。
(× False) Under 'the next process is the customer', passing minor defects along because the next inspection will catch them is FALSE. - 【○正しい】段取り替え後に最初の製品を検査する目的は、設定や加工条件を確認し不良の大量発生を防ぐことである。
(○ True) The purpose of inspecting the first piece after a changeover is to verify setup conditions and prevent mass defects. - 【○正しい】不良品発見時は識別して良品と分けて上司へ報告し、機械の異常音がしたときは機械を止めて報告する。
(○ True) Separate and report defective items when found, and stop the machine safely and report immediately if abnormal noise occurs.
| Word | Meaning |
|---|---|
| 後工程 | next (downstream) process |
| 段取り替え | setup change (changeover) |
| 不良品 | defective product |
| 良品 | good (non-defective) product |
| 保全担当者 | maintenance personnel |
ロット・トレーサビリティとPDCA・なぜなぜ分析
Lots, Traceability, PDCA Cycle, and Why-Why Analysis
生産管理において、同じ条件のもとで製造される製品のまとまり(単位)を「ロット」といいます。
In production control, a group (unit) of products manufactured under the same conditions is called a 'lot'.
製品に問題が見つかったとき、材料や製造日・ロット番号などの履歴をさかのぼって調べられる仕組みを「トレーサビリティ」といいます。
A system that allows tracing back material history, production date, and lot numbers when a defect occurs is called 'traceability'.
業務改善のPDCAサイクルは、「計画(Plan)→実行(Do)→評価(Check)→改善(Action)」の順に回します。
The PDCA cycle for continuous improvement follows the order: Plan → Do → Check → Action.
問題が起きたときに「なぜ」を繰り返して根本的な原因を探す分析手法を「なぜなぜ分析」といいます。
Repeating 'Why?' multiple times when a problem occurs to find its root cause is called 'Why-Why analysis' (Naze-naze analysis).
Key points
- 【○正しい】同じ条件で製造される製品のまとまり(単位)を「ロット」という。
(○ True) A unit of products manufactured together under identical conditions is called a 'lot'. - 【×誤り】製造履歴をさかのぼって調べる仕組みを「段取り替え」というのは誤り(正しくは「トレーサビリティ」)。
(× False) Calling the system for tracing back material and lot history 'changeover (Dandorigae)' is FALSE (it is 'traceability'). - 【×誤り】PDCAの順序を「実行・計画・改善・評価」としたり、「なぜ」を繰り返す分析を「全数検査」というのは誤り。
(× False) Stating the PDCA order as 'Do, Plan, Action, Check' or calling repeated 'Why' root-cause analysis '100% inspection' is FALSE.
| Word | Meaning |
|---|---|
| ロット | lot (production batch) |
| トレーサビリティ | traceability |
| PDCAサイクル | PDCA cycle |
| なぜなぜ分析 | Why-Why analysis |
| 全数検査 | 100% (full) inspection |
QC七つ道具①(パレート図・ヒストグラム・チェックシート・層別)
Seven QC Tools (1): Pareto Chart, Histogram, Check Sheet, and Stratification
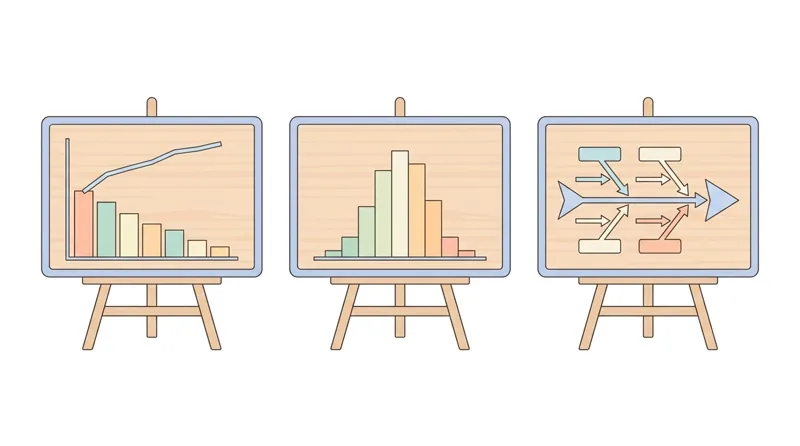
不良の種類を件数の多い順に棒グラフで並べ、累積比率を折れ線で示す図を「パレート図」といいます。
A chart that orders defect types from most frequent to least frequent with bars and shows cumulative percentage with a line is a 'Pareto chart'.
製品の寸法などのデータを区間に分け、各区間に入る個数を棒で表してばらつきを見る図を「ヒストグラム」といいます。
A chart that divides measurement data into intervals and uses vertical bars to show frequency distribution and variation is a 'histogram'.
確認項目や不良の件数をチェックしながら簡単に記録できるようにした表を「チェックシート」といいます。
A pre-formatted table used to easily record and tally defect counts or inspection items by checking them off is a 'check sheet'.
データを機械別や作業者別・材料別など、性質の同じグループに分けて調べる方法を「層別」といいます。
Dividing data into groups with shared characteristics—such as by machine, operator, or material lot—to investigate patterns is called 'stratification'.
Key points
- 【○正しい】不良を件数の多い順に並べて累積比率も示す図は「パレート図」である。
(○ True) A chart showing defect counts in descending order along with a cumulative percentage curve is a 'Pareto chart'. - 【○正しい】寸法データを区間に分けてばらつきを見る図は「ヒストグラム」、グループに分けて調べる方法は「層別」である。
(○ True) A bar chart showing data dispersion across intervals is a 'histogram', and grouping data by machine or worker is 'stratification'. - 【×誤り】チェックしながら簡単に件数を記録する表を「パレート図」というのは誤り(正しくは「チェックシート」)。
(× False) Calling a simple tally table for checking off defect counts a 'Pareto chart' is FALSE (it is a 'check sheet').
| Word | Meaning |
|---|---|
| パレート図 | Pareto chart |
| 累積比率 | cumulative ratio |
| ヒストグラム | histogram |
| チェックシート | check sheet |
| 層別 | stratification |
QC七つ道具②(特性要因図・管理図)と検査記録
Seven QC Tools (2): Cause-and-Effect Diagram, Control Chart, and Records
結果(特性)と原因(要因)の関係を、魚の骨のような形で整理する図を「特性要因図」といいます。
A diagram that organizes the relationship between a result (effect) and its causes in a fishbone shape is a 'cause-and-effect diagram'.
特性要因図で原因候補(例:材料の硬さのばらつき)が挙がったら、実際のデータを調べて原因かどうか確認します。
When a candidate cause (such as material hardness variation) is identified on a fishbone diagram, investigate actual data to verify whether it is the true cause.
工程の状態を時間の流れに沿って記録し、管理限界線を使って異常を見つける図を「管理図」といいます。
A chart that tracks process state over time and uses upper and lower control limit lines to detect abnormalities is a 'control chart'.
製品の検査結果を記録するときは、実際の結果を所定の方法で正確に記録し、異常があれば直ちに報告します。
Always record actual inspection results accurately using the prescribed method, and report any abnormalities immediately.
Key points
- 【×誤り】魚の骨の形で原因と結果を整理する図を「ヒストグラム」というのは誤り(正しくは「特性要因図」)。
(× False) Calling a fishbone-shaped diagram that organizes causes and effects a 'histogram' is FALSE (it is a 'cause-and-effect diagram'). - 【×誤り】管理限界線を使って時間に沿って異常を見つける図を「特性要因図」というのは誤り(正しくは「管理図」)。
(× False) Calling a time-series chart with control limit lines a 'cause-and-effect diagram' is FALSE (it is a 'control chart'). - 【○正しい】特性要因図で原因候補が挙がったらデータを調べて確認し、検査結果は実際の値を正確に記録する。
(○ True) Verify candidate causes from a fishbone diagram against actual data, and record actual inspection results accurately.
| Word | Meaning |
|---|---|
| 特性要因図 | cause-and-effect (fishbone) diagram |
| 管理図 | control chart |
| 管理限界線 | control limit lines |
| 検査結果 | inspection result |
Quality Control and 5S
Practice this chapter in the appOfficial references
- 製造分野特定技能1号評価試験(経済産業省・JAIM) — https://www.jaim-skill.or.jp/exam/about-ssw1/
- 製造分野特定技能評価試験 試験基準(別紙) — https://www.jaim-skill.or.jp/assets/files/exam/top/exam_criteria.pdf