
Quality Control (4 Qualities, Statistics, QC 7 Tools, Sampling Inspection, ISO 9001)
品質管理(4つの品質・統計量・QC七つ道具・抜取検査・ISO 9001)
Production Management Planning Grade 3 生産管理プランニング (BC検定) · ビジネス・キャリア検定 生産管理プランニング3級 · Written by Tokutei Pass based on the official study texts; not copied verbatim.
1. 4つの品質(要求・設計・製造・保証品質)と代用特性・PDCA
1. The 4 Qualities (Required, Design, Manufacturing, Guaranteed Quality), Substitute Characteristics, and PDCA
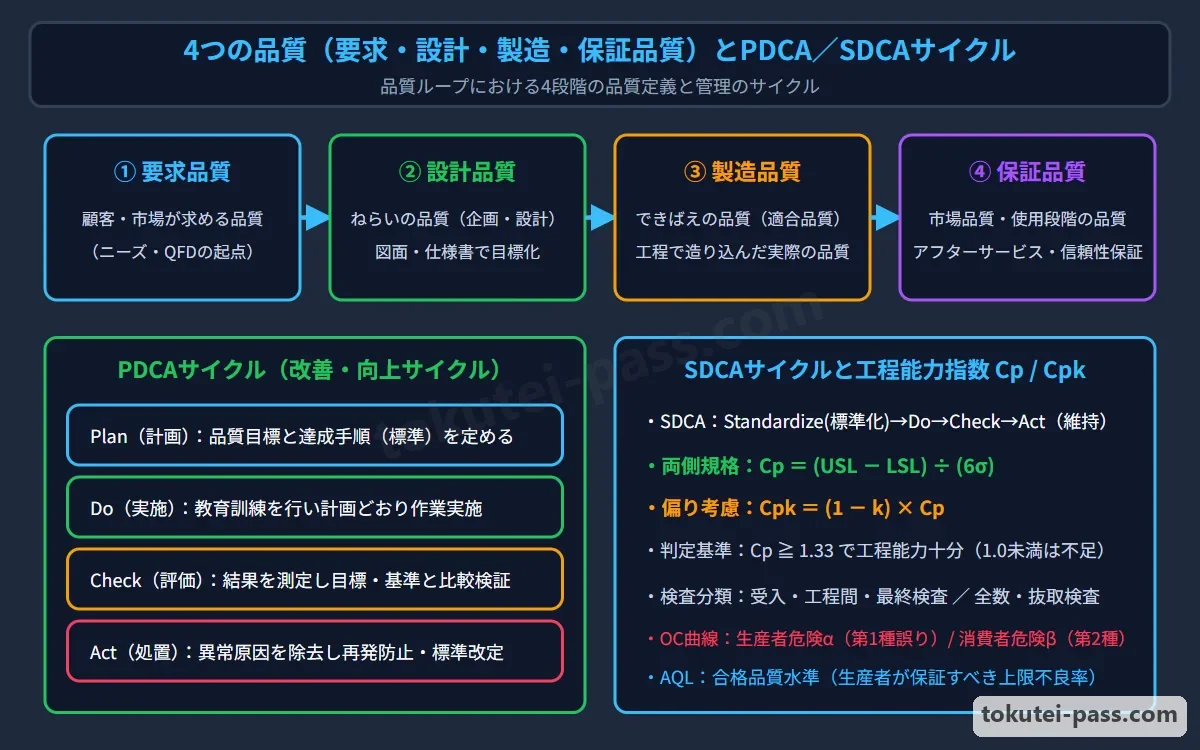
製品の品質は企業活動に沿って「4つの品質」として捉えます。①顧客や市場が求める「要求品質」、②それを基に企画・設計段階で狙い定める「設計品質(ねらいの品質)」、③図面どおりに製造された結果の「製造品質(できばえの品質・適合品質)」、④アフターサービスを含め使用段階で保証される「保証品質(市場品質)」です。
Product quality is grasped along the flow of corporate activities as the 'Four Qualities': (1) Required Quality demanded by customers and the market; (2) Design Quality (target quality / nerai no hinshitsu) aimed for at the planning and design stage based on those requirements; (3) Manufacturing Quality (quality of conformance / dekibae no hinshitsu) actually produced according to design drawings; and (4) Guaranteed Quality (market quality) assured to customers during usage, including sales and after-sales service.
また、消費者が本来求める「使いやすい・壊れにくい・書きやすい」といった要求品質を「真の特性」と呼びますが、そのままでは測定・管理しにくいため、寸法・硬さ・引張強さなど数値で測れる「代用特性(品質特性)」に置き換えて管理します。
Furthermore, the inherent quality requirements consumers truly desire—such as easy to use, durable, smooth to write with—are called True Characteristics, but because they cannot be measured directly, they are translated into quantifiable, measurable values like dimensions, hardness, or tensile strength called Substitute Characteristics (quality characteristics).
製造現場の品質管理では、「品質は検査ではなく工程で作り込む」「後工程はお客様(不良品を受け取らない・作らない・流さない)」を鉄則とし、作業者(Man)・機械(Machine)・材料(Material)・方法(Method)の「4M」のばらつきを抑えます。
In shop-floor quality control, the ironclad rules are 'Quality must be built into the process, not inspected in' and 'The next process is the customer (do not accept, do not make, and do not pass on defects),' controlling variation across the 4Ms: Man (operators), Machine (equipment), Material, and Method.
そして日常は作業標準に従う「SDCA(標準S→実施D→確認C→処置A)」で品質を維持し、さらなる向上や問題解決には「PDCA(計画P→実施D→確認C→処置A)」を回して改善をスパイラルアップさせます。
Daily operations maintain quality by running the SDCA cycle (Standardize → Do → Check → Act) following work standards, while further improvements and problem solving run the PDCA cycle (Plan → Do → Check → Act) to spiral quality upward.
Key points
- 4つの品質の流れ:①要求品質(市場ニーズ)→②設計品質(ねらいの品質)→③製造品質(できばえの品質)→④保証品質(使用・サービス段階の品質)。
Flow of the 4 Qualities: (1) Required Quality (market needs) → (2) Design Quality (target quality) → (3) Manufacturing Quality (conformance quality) → (4) Guaranteed Quality (quality at the usage and service stage). - 真の特性=顧客が求める本来の要求(壊れにくい等)/代用特性=真の特性を保証するため数値化した測定値(引張強さ・寸法等)。
True Characteristic = the customer's inherent requirement (e.g., durability) / Substitute Characteristic = quantifiable measured values (tensile strength, dimensions) set to assure the true characteristic. - 4M(人・機械・材料・方法)のばらつきを管理し、維持の「SDCA」と改善の「PDCA」を回して工程で品質を作り込む。
Control variation in the 4Ms (Man, Machine, Material, Method) and rotate SDCA for maintenance and PDCA for improvement to build quality into the process.
| Word | Meaning |
|---|---|
| 4つの品質(要求品質・設計品質・製造品質・保証品質) | Four Qualities (Required quality, Design quality, Manufacturing quality, Guaranteed quality) |
| ねらいの品質とできばえの品質・真の特性と代用特性 | Target quality & Conformance quality, True characteristics & Substitute characteristics |
| 後工程はお客様 | The next process is the customer |
| PDCAサイクルとSDCAサイクル | PDCA cycle and SDCA cycle |
2. データの種類(計量値・計数値)と基本統計量(平均・中央値・範囲・分散・標準偏差)
2. Types of Data (Continuous / Discrete) and Basic Statistics (Mean, Median, Range, Variance, Standard Deviation)
品質データは2種類に分かれます。長さ(mm)・重さ(g)・温度(℃)・時間(秒)など連続する値を測定器で測るデータを「計量値」と呼び、その分布は主に「正規分布」に従います。
Quality data falls into two types. Continuous values measured with instruments—such as length (mm), weight (g), temperature (℃), or time (seconds)—are called Continuous Data (Variables / Keiryouchi), and their distribution primarily follows the Normal Distribution.
これに対し、1個、2個と数える不連続なデータを「計数値」と呼びます。計数値のうち、不適合品(不良品)の個数や不適合品率は「二項分布」に従い、布の傷や塗装ブツなどの「欠点数(不適合数)」は「ポアソン分布」に従います。
In contrast, discrete data counted in whole units (1 piece, 2 pieces) is called Discrete Data (Attributes / Keisuuchi). Within discrete data, the number or proportion of nonconforming (defective) units follows the Binomial Distribution, whereas the number of defects (nonconformities) such as cloth scratches or paint specks follows the Poisson Distribution.
データの中心位置(代表値)を表す統計量には、全データの合計をデータ数nで割った「平均値(xバー)」、データを小さい順に並べたときちょうど真ん中にくる「中央値(メディアン:データ数が偶数なら中央2つの平均)」、最も出現回数が多い「最頻値(モード)」があります。
Statistics representing the central location (representative value) of data include the Mean (Average, x-bar), found by dividing the sum of all data by sample size n; the Median, the middle value when data is arranged in ascending order (or average of the two middle values if n is even); and the Mode, the most frequently occurring value.
一方、データのばらつきの大きさを表す統計量には、「範囲(R=最大値-最小値)」のほか、各データから平均値を引いて2乗した和である「偏差平方和(S)」、Sを自由度(n-1)で割った「不偏分散(V=S÷(n-1))」、分散の正の平方根をとった「標本標準偏差(s=√V)」があります。
Meanwhile, statistics representing data dispersion (spread) include the Range (R = Maximum - Minimum); the Sum of Squares of Deviations (S), found by subtracting the mean from each data point, squaring the differences, and summing them; the Unbiased Variance (V = S ÷ (n - 1)), dividing S by degrees of freedom (n - 1); and the Sample Standard Deviation (s = √V), the positive square root of variance.
Key points
- 計量値(長さ・重さ・温度など連続量)→正規分布/計数値(個数を数える離散量)→不良品数は二項分布、欠点数はポアソン分布。
Continuous Data (length, weight, temperature) → Normal Distribution / Discrete Data (counted quantities) → Number of defective units follows Binomial Distribution; number of defects follows Poisson Distribution. - 代表値:平均値=総和÷データ数n/中央値(メディアン)=小さい順に並べた中央の値/最頻値(モード)=最も度数が多い値。
Central tendency: Mean = Sum ÷ n / Median = middle value when sorted in order / Mode = most frequent value. - ばらつきの尺度:範囲R=最大値-最小値/不偏分散V=偏差平方和S÷(n-1)/標準偏差s=√V。
Dispersion measures: Range R = Max - Min / Unbiased Variance V = Sum of Squares S ÷ (n - 1) / Standard Deviation s = √V. - 【例】5個の測定値(7, 9, 11, 11, 12mm) → 平均値=(7+9+11+11+12)÷5=10mm、中央値(メジアン)=11mm、最頻値(モード)=11mm、範囲R=12-7=5mm
Example: 5 measurements (7, 9, 11, 11, 12 mm) → Mean = (7 + 9 + 11 + 11 + 12) ÷ 5 = 10 mm, Median = 11 mm, Mode = 11 mm, Range R = 12 - 7 = 5 mm - 【例】同じ5個のデータ(平均10mm) → 偏差平方和S=(7-10)²+(9-10)²+(11-10)²+(11-10)²+(12-10)²=16、不偏分散V=16÷(5-1)=4、標本標準偏差s=√4=2mm
Example: Same 5 data points (mean 10 mm) → Sum of squares S = (7 - 10)² + (9 - 10)² + (11 - 10)² + (11 - 10)² + (12 - 10)² = 16, Unbiased variance V = 16 ÷ (5 - 1) = 4, Sample standard deviation s = √4 = 2 mm
| Word | Meaning |
|---|---|
| 計量値(正規分布)と計数値(二項・ポアソン分布) | Continuous data (Normal distribution) and discrete data (Binomial / Poisson distribution) |
| 平均値・中央値(メディアン)・最頻値(モード) | Mean, Median, and Mode |
| 範囲(R)と偏差平方和(S) | Range (R) and Sum of Squares of Deviations (S) |
| 不偏分散(V)と標準偏差(s) | Unbiased Variance (V) and Standard Deviation (s) |
3. 統計図表(グラフ)の特徴と使い分け(レーダーチャート・Zチャート等)
3. Characteristics and Selection of Statistical Charts (Radar Chart, Z-Chart, etc.)
数値データを視覚的にわかりやすく表現するため、目的に応じて適切な統計図表(グラフ)を使い分けます。数量の「大小比較」には「棒グラフ」、時間の経過に伴う「増減変化(推移)」には「折れ線グラフ」を用います。
To present numerical data visually and clearly, statistical charts are selected according to purpose. Bar Charts are used for comparing magnitude across categories, while Line Charts are used for showing upward or downward trends over time.
全体に対する各項目の「内訳・構成比(割合)」を示すには「円グラフ」や「帯グラフ」が適しており、特に帯グラフを縦に複数並べると、年次ごとや工場ごとの構成比の推移・比較が一目でわかります。
To show the breakdown or composition ratio (%) of each item relative to the whole, Pie Charts and Band (Stacked Bar) Charts are suitable; stacking multiple band charts vertically makes year-by-year or plant-by-plant composition changes immediately clear.
また、複数の評価項目(例:P・Q・C・D・S・Mの6項目や作業者の多能工スキル)を中心から放射状の軸にとり、全体のバランスや弱点をクモの巣状の多角形で示すグラフを「レーダーチャート(クモの巣グラフ)」と呼びます。
A chart that plots multiple evaluation items (e.g., the 6 items P, Q, C, D, S, M or worker multi-skill levels) on axes radiating from a center to display overall balance and weaknesses as a web-like polygon is called a Radar Chart (Spiderweb Chart).
さらに、売上高や生産高について①月次(単月)高、②月次累計高、③移動年計(直近12か月分の合計)の3本の折れ線を1つの図に描き、アルファベットの「Z」の形で短期変動と長期傾向を同時に捉える図を「Zチャート」と呼びます。
Furthermore, a chart that plots three line graphs of sales or production on a single chart—(1) Monthly total, (2) Cumulative monthly total, and (3) Moving annual total (sum of the most recent 12 months)—forming the letter Z to capture short-term fluctuations and long-term trends simultaneously is called a Z-Chart.
Key points
- 棒グラフ=大小の比較/折れ線グラフ=時系列の推移・変化/円・帯グラフ=内訳・構成比(割合)の把握。
Bar Chart = comparing sizes / Line Chart = time-series trends and changes / Pie & Band Charts = grasping breakdown and composition ratios (%). - レーダーチャート(クモの巣グラフ)=複数の評価項目の全体バランス・長所と短所を比較するのに適する。
Radar Chart (Spiderweb Chart) = ideal for comparing overall balance, strengths, and weaknesses across multiple evaluation criteria. - Zチャート=「月次・累計・移動年計」の3本の折れ線で、季節変動を除いた長期トレンドと目標達成度を把握する。
Z-Chart = uses 3 lines (Monthly, Cumulative, Moving Annual Total) to grasp long-term trends free of seasonal fluctuations as well as target achievement.
| Word | Meaning |
|---|---|
| 棒グラフ・折れ線グラフ・円グラフ・帯グラフ | Bar chart, line chart, pie chart, and band chart |
| レーダーチャート(クモの巣グラフ) | Radar Chart (spiderweb chart) |
| Zチャート(月次・累計・移動年計) | Z-Chart (monthly, cumulative, and moving annual total) |
4. QC七つ道具①(パレート図・特性要因図・チェックシート・層別)
4. The QC 7 Tools (1) (Pareto Chart, Cause-and-Effect Diagram, Check Sheet, Stratification)
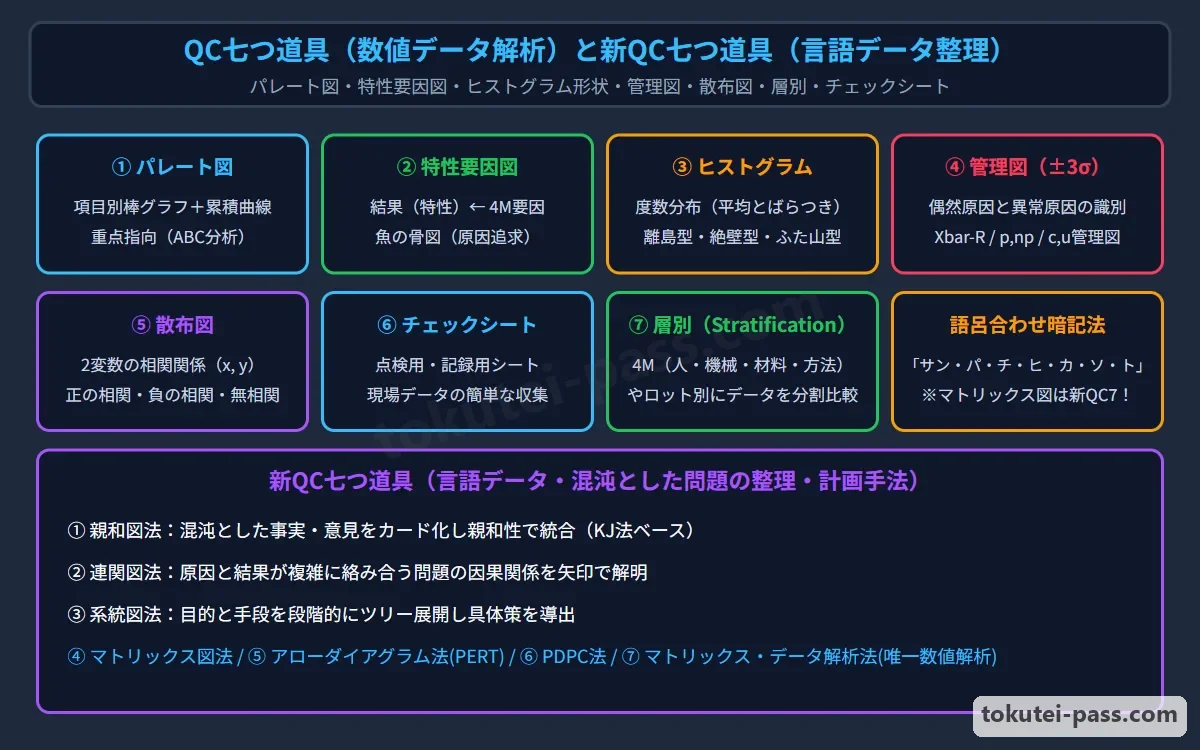
現場の数値データを整理・分析する基本手法が「QC七つ道具」です。1つ目の「パレート図」は、不良項目や原因別に件数・損失金額を大きい順に並べた棒グラフと、その累積比率(%)を示す折れ線グラフを組み合わせ、「どの重点問題から手をつけるべきか」を明確にする図です。
The foundational toolkit for organizing and analyzing shop-floor numerical data is the QC 7 Tools. First, the Pareto Chart combines a bar graph sorting defect items or causes in descending order of frequency or loss amount with a line graph showing the cumulative percentage (%), clarifying which vital priority problem should be tackled first.
2つ目の「特性要因図」は、結果である「特性(不良など)」を背骨の右端に置き、そこに影響する「要因(4Mなど)」を大骨・中骨・小骨へと体系的に整理した図で、形が魚の骨に似ていることから「フィッシュボーンチャート(魚の骨図)」とも呼ばれます。
Second, the Cause-and-Effect Diagram places the resulting characteristic (such as a defect) at the right end of a central spine and systematically branches the contributing factors (such as the 4Ms) into large, medium, and small bones; because it resembles a fish skeleton, it is also called a Fishbone Chart (Ishikawa Diagram).
3つ目の「チェックシート」は、データ収集を簡単にし集計や点検の忘れを防ぐため、あらかじめ項目を印刷して記録・チェックできるようにした表(記録用と点検確認用)です。
Third, a Check Sheet is a pre-formatted table printed with check items so operators can easily record data or verify inspection points without omission (divided into recording check sheets and confirmation/inspection check sheets).
4つ目の「層別」は、収集したデータをそのまま1つにまとめるのではなく、材料メーカー別・機械(号機)別・作業者別・昼夜勤別など共通の特徴(層)ごとにグループ分けして比較し、ばらつきの真の原因をあぶり出す考え方です(ヒストグラムや散布図と組み合わせて使います)。
Fourth, Stratification is the practice of dividing collected data into subgroups (strata) sharing common attributes—such as by material supplier, machine number, operator, or day/night shift—rather than lumping all data together, comparing them to uncover the true source of variation (used together with histograms and scatter diagrams).
Key points
- パレート図=項目別の棒グラフ(降順)+累積比率の折れ線グラフで、最優先の重点改善テーマを特定する。
Pareto Chart = descending bar chart by category + cumulative percentage line chart, used to identify the top-priority improvement theme. - 特性要因図(魚の骨図)=結果(特性)と原因(4Mなどの要因)の因果関係を体系的に整理する。
Cause-and-Effect Diagram (Fishbone Chart) = systematically organizes cause-and-effect relationships between a result (characteristic) and its causes (4M factors). - 層別=データを機械別・材料ロット別・作業者別などのグループ(層)に分けて比較し、違いの原因を見つける。
Stratification = separating data into groups (strata) by machine, material lot, or operator to compare and pinpoint the cause of differences. - 【例】不良総数100件(第1位:寸法不良50件、第2位:外観傷30件、その他20件) → パレート図の上位2項目の累積比率=(50+30)÷100×100=80%
Example: 100 total defects (1st: dimensional defect 50, 2nd: surface scratch 30, others: 20) → Cumulative percentage of top 2 items on Pareto chart = (50 + 30) ÷ 100 × 100 = 80%
| Word | Meaning |
|---|---|
| パレート図(重点指向・ABC分析) | Pareto Chart (priority orientation and ABC analysis) |
| 特性要因図(魚の骨図・フィッシュボーン) | Cause-and-Effect Diagram (Fishbone Chart) |
| チェックシート(記録用・点検用) | Check Sheet (for data recording and for inspection) |
| 層別(グループ分け比較) | Stratification (subgroup comparison) |
5. QC七つ道具②(ヒストグラムの形状・散布図・管理図)
5. The QC 7 Tools (2) (Histogram Shapes, Scatter Diagram, Control Chart)
5つ目の「ヒストグラム(度数分布図)」は、計量値データの範囲をいくつかの区間(階級)に分け、各区間に入るデータ数(度数)を柱状グラフにして、中心位置・ばらつきの形・規格値との余裕を見る図です。
Fifth, a Histogram (frequency distribution chart) divides the range of continuous data into intervals (classes) and plots the number of data points (frequency) in each class as vertical bars to examine central location, spread shape, and margin relative to specification limits.
ヒストグラムの形状には、正常な左右対称の「一般型(正規型)」のほか、区間幅が測定目盛りの整数倍でないときに出る「櫛歯型」、規格外を選別除去したときに片側が切り立つ「絶壁型」があります。
Regarding histogram shapes, besides the normal symmetrical Bell-Shaped (General/Normal) Type, there is the Comb-Shaped (Multimodal Teeth) Type caused when class width is not an integer multiple of the measurement scale, and the Cliff-Like (Truncated) Type sharply cut off on one side when nonconforming items have been screened out.
さらに、平均値が少しずつ異なる複数のロットが混ざった「高原型」、異質なデータが少量混入したり測定ミスがあったりした「離れ小島型」、平均値の異なる2台の機械や2社の材料が混ざった「二山型(双峰型)」があり、高原型や二山型は「層別」で原因を分けます。
Additionally, the Plateau Type occurs when multiple lots with slightly different means are mixed; the Isolated Island Type occurs when a small amount of abnormal data or measurement error is mixed in; and the Twin-Peak (Bimodal) Type occurs when outputs from two machines or two material suppliers with different means are mixed (Plateau and Twin-Peak types require Stratification).
6つ目の「散布図」は、対になった2つの変数(例:焼成温度xと硬度y)を縦軸・横軸にとって打点し、両者の「相関関係(正の相関=右肩上がり、負の相関=右肩下がり、無相関)」を調べる図です。
Sixth, a Scatter Diagram plots paired variables (e.g., firing temperature x and hardness y) on horizontal and vertical axes to examine their correlation (positive correlation = upward slope to the right, negative correlation = downward slope to the right, or no correlation).
7つ目の「管理図」は、工程が安定状態にあるか異常原因が働いたかを時系列で判定するため、「中心線(CL)」の上下に標準偏差の3倍(±3σ)の幅で「上方管理限界線(UCL)」と「下方管理限界線(LCL)」を引いた図です。
Seventh, a Control Chart evaluates over time whether a process is in a stable state or affected by assignable (special) causes by drawing an Upper Control Limit (UCL) and Lower Control Limit (LCL) at plus and minus 3 standard deviations (±3σ) above and below the Center Line (CL).
管理図では、打点が管理限界線の外に出た場合だけでなく、限界線の内側にあっても中心線の片側に連続して並ぶ「連(7〜9点以上)」や、連続上昇・下降する「傾向(トレンド)」、「周期性」が見られる場合も工程異常と判定します。
On a control chart, a process is judged abnormal not only when a point falls outside the control limits, but also when points inside the limits exhibit a Run (7 to 9 or more consecutive points on one side of the center line), a continuous upward or downward Trend, or Periodicity (cycles).
Key points
- ヒストグラムの形状:絶壁型=規格外の選別除去/二山型=平均の異なる2つの機械・材料の混在(層別が必要)/離れ小島型=異質データの少数混入・測定ミス。
Histogram shapes: Cliff-like = 100% screening removal of out-of-spec items / Twin-peak = mixture of 2 machines or materials with different means (needs stratification) / Isolated island = minor inclusion of abnormal data or measurement error. - 散布図=2変数の相関を見る図(xが増えるとyも増える右肩上がり=正の相関、yが減る右肩下がり=負の相関)。
Scatter Diagram = examines correlation between 2 variables (y increases as x increases = positive correlation; y decreases as x increases = negative correlation). - 管理図=CL(中心線)±3σにUCL・LCLを引き、管理限界線外の点や、限界内でも「連(片側連続)・傾向(連続上昇/下降)」があれば工程異常と判定する。
Control Chart = draws UCL and LCL at CL ± 3σ; judges the process abnormal if points fall outside limits or show a Run or Trend even within limits.
| Word | Meaning |
|---|---|
| ヒストグラム(絶壁型・二山型・離れ小島型・櫛歯型) | Histogram (cliff-like, twin-peak, isolated island, comb-shaped) |
| 散布図(正の相関・負の相関) | Scatter Diagram (positive correlation and negative correlation) |
| 管理図(UCL・CL・LCL:3シグマ法) | Control Chart (UCL, CL, LCL: 3-sigma method) |
| 管理図の異常判定(限界線外・連・傾向) | Control chart abnormality rules (out-of-limits, Run, Trend) |
6. 検査の分類と抜取検査(OC曲線・生産者危険α・消費者危険β)
6. Classification of Inspections and Sampling Inspection (OC Curve, Producer's Risk α, Consumer's Risk β)
検査とは、品物を測定・試験した結果を判定基準と比較して、個々の品物の「良品・不良品」またはロットの「合格・不合格」を判定することです。段階別には受入(購入)検査・工程間(中間)検査・最終(出荷)検査があり、方法別には破壊検査・非破壊検査・人間の五感で判定する「官能検査」があります。
Inspection is the act of measuring or testing items and comparing the results against acceptance criteria to judge whether individual items are conforming (good) or nonconforming (defective) or whether a lot is accepted or rejected. By stage, there are receiving, in-process, and final inspections; by method, destructive, non-destructive, and Sensory Inspection using the human five senses.
また対象数により「全数検査」と「抜取検査」に分かれます。不良品が1個でも混ざると人命に関わる重要保安部品や高価な単品製品は「全数検査」を行いますが、引張破壊試験などの「破壊検査」や大量のネジ、連続流体・粉体などは全数検査が不可能なため必然的に「抜取検査」となります。
By sample coverage, inspection is divided into 100% (Total) Inspection and Sampling Inspection. Critical safety parts where even one defect threatens human life or expensive one-off products require 100% Inspection, whereas Destructive Testing (like tensile breaking tests), high-volume cheap screws, and continuous fluids or powders cannot undergo 100% inspection and necessitate Sampling Inspection.
抜取検査では、ロットからランダムに抜き取ったサンプルのみを調べるため、確率的に2種類の判定ミスが避けられません。ロットの真の不良率とロットが合格する確率の関係を示した曲線を「OC曲線(検査特性曲線)」と呼びます。
Because sampling inspection examines only random samples drawn from a lot, two types of probabilistic judgment errors are unavoidable. The curve plotting the relationship between a lot's true fraction defective and its probability of acceptance is called the OC Curve (Operating Characteristic Curve).
第1の誤りは、本来は良いロット(合格させるべき品質水準AQLのロット)なのに、たまたま不良品が多く抜き取られて不合格にしてしまう確率で、「生産者危険(α:第1種の誤り・あわてものの誤り、通常約5%)」と呼びます。
The Type I error is the probability that a good lot (at Acceptable Quality Level, AQL) happens to yield many defective samples and is mistakenly rejected; this is called Producer's Risk (α: Type I error / hasty error, typically set around 5%).
第2の誤りは、本来は悪いロット(不合格にすべき限界品質LQのロット)なのに、たまたま良品ばかりが抜き取られて合格にしてしまう確率で、「消費者危険(β:第2種の誤り・ぼんやりものの誤り、通常約10%)」と呼びます。
The Type II error is the probability that a bad lot (at Limiting Quality, LQ, which should be rejected) happens to yield mostly good samples and is mistakenly accepted; this is called Consumer's Risk (β: Type II error / careless error, typically set around 10%).
Key points
- 破壊検査や大量低単価品・液体粉体は「抜取検査」しかできない/人命に関わる重要部品は「全数検査」。
Destructive tests, high-volume low-cost items, and liquids/powders can only use Sampling Inspection / Life-critical safety components require 100% Inspection. - 生産者危険(α:あわてものの誤り)=良いロットを誤って「不合格」にしてしまい、生産者が損をする確率。
Producer's Risk (α: hasty error) = probability of mistakenly rejecting a good lot, harming the producer. - 消費者危険(β:ぼんやりものの誤り)=悪いロットを誤って「合格」にしてしまい、消費者が損をする確率。
Consumer's Risk (β: careless error) = probability of mistakenly accepting a bad lot, harming the consumer.
| Word | Meaning |
|---|---|
| 全数検査と抜取検査(破壊検査・官能検査) | 100% inspection and sampling inspection (destructive and sensory inspection) |
| OC曲線(検査特性曲線) | OC Curve (Operating Characteristic Curve) |
| 生産者危険(α:あわてものの誤り) | Producer's Risk (α: Type I / hasty error) |
| 消費者危険(β:ぼんやりものの誤り) | Consumer's Risk (β: Type II / careless error) |
7. 2つのQCストーリー(問題解決型と課題達成型)とPL法の立証3要件
7. Two Types of QC Story (Problem-Solving vs Task-Achieving) and 3 Proof Requirements of the PL Law
改善手順の「QCストーリー」には2種類あります。発生している不良の原因を究明してあるべき姿に戻す「問題解決型(テーマ選定→現状把握→目標設定→要因解析→対策実施→効果確認→標準化)」と、新製品開発や未経験の挑戦的目標を目指す「課題達成型(テーマ選定→攻めどころ選定・目標設定→方策検討→成功シナリオ追求)」です。
The QC Story improvement procedure has two types: the Problem-Solving QC Story, which investigates causes of existing defects or worsened conditions to restore the desired state (Theme selection → Current status → Target setting → Cause analysis → Countermeasures → Effect confirmation → Standardization); and the Task-Achieving QC Story, which aims for new product development or unprecedented ambitious goals (Theme selection → Selecting focal attack points & Target setting → Studying measures → Pursuing a success scenario).
また不良への対応では、すでに発生した「顕在的不適合」の真因を除く再発防止(是正処置)だけでなく、まだ起きていない「潜在的不適合」を予測して防ぐ未然防止(予防処置)が重要です。万一、製品の欠陥で消費者の生命・身体または財産に被害が生じた際に救済する法律が「製造物責任法(PL法)」です。
In addressing nonconformities, besides recurrence prevention (corrective action) that removes root causes of overt/existing nonconformities that have already occurred, proactive prevention (preventive action) that predicts and prevents latent/potential nonconformities before they occur is vital. If a product defect causes damage to a consumer's life, body, or property, the law providing victim relief is the Product Liability Act (PL Law).
PL法はメーカーの「故意・過失」を問わない「無過失責任(欠陥責任)」を採用しており、被害者が損害賠償を求める際に立証(証明)すべき事項は、①当該製品に「欠陥」が存在していたこと、②「損害」が発生したこと、③欠陥と損害の間に「因果関係」があることの3点のみです。
The PL Law adopts Strict Liability (no-fault / defect liability) regardless of the manufacturer's intent or negligence; when victims claim damages, they need only prove three elements: (1) a Defect existed in the product, (2) Damage occurred, and (3) a Causal Relationship existed between the defect and the damage.
なおPL法の対象となる「製造物」は「製造または加工された動産(不動産・未加工農産物・ソフトウェア単体は対象外)」であり、欠陥は①設計上の欠陥、②製造上の欠陥、③指示・警告上の欠陥(取扱説明書等の不備)の3つに分類されます。
Products covered by the PL Law are manufactured or processed movables (real estate, unprocessed agricultural goods, and standalone software are excluded), and defects are classified into three types: (1) Design Defects, (2) Manufacturing Defects, and (3) Instruction/Warning Defects (inadequate manuals, etc.).
Key points
- 問題解決型QCストーリー=発生している問題の「要因解析」を行い真因を除去する/課題達成型QCストーリー=魅力的な新目標に対し「攻めどころ」と「方策・成功シナリオ」を追求する。
Problem-Solving QC Story = performs cause analysis on existing problems to remove root causes / Task-Achieving QC Story = pursues focal attack points and measures/success scenarios for attractive new goals. - PL法で被害者が立証すべき3要件:①製品の「欠陥」、②発生した「損害」、③両者の「因果関係」(※メーカーの故意・過失の立証は不要)。
Three requirements a victim must prove under the PL Law: (1) Product Defect, (2) Occurred Damage, (3) Causal Relationship between the two (proving manufacturer intent or negligence is NOT required). - PL法の対象は「製造・加工された動産」であり、3つの欠陥は「設計上の欠陥・製造上の欠陥・指示警告上の欠陥」。
The PL Law covers manufactured or processed movables, and its 3 defect types are Design Defects, Manufacturing Defects, and Instruction/Warning Defects.
| Word | Meaning |
|---|---|
| 問題解決型QCストーリーと課題達成型QCストーリー | Problem-Solving QC Story and Task-Achieving QC Story |
| 製造物責任法(PL法)と被害者の立証3要件 | Product Liability Act (PL Law) and Victim's 3 proof requirements |
| 顕在的不適合(是正処置)と潜在的不適合(予防処置) | Overt nonconformity (corrective action) and Latent nonconformity (preventive action) |
| 設計・製造・指示警告上の欠陥 | Design, Manufacturing, and Instruction/Warning Defects |
8. FMEA・FTAとISO 9001(2015年版の強調点と品質マネジメント7原則)
8. FMEA / FTA and ISO 9001 (2015 Edition Emphasis & 7 Quality Management Principles)
設計・工程段階で故障や不良を未然防止する信頼性解析手法に「FMEA」と「FTA」があります。「FMEA(故障モード影響解析)」は、構成部品のあらゆる故障モード(断線・摩耗など)から出発してシステム全体への影響を上向きに調べる「ボトムアップ手法」です。
Two reliability analysis techniques used to prevent failures and defects at the design and process stages are FMEA and FTA. FMEA (Failure Mode and Effects Analysis) is a Bottom-Up Method that starts from potential failure modes of individual component parts (such as wire breakage or wear) and traces upward to evaluate their impact on the overall system.
これに対し「FTA(故障の木解析)」は、起きてはならない重大事故(頂上事象)から出発し、その発生原因を論理記号(ANDゲート・ORゲート)で木の根のように下向きに展開して追究する「トップダウン手法」です。
In contrast, FTA (Fault Tree Analysis) is a Top-Down Method that starts from an undesirable major accident (the Top Event) and unfolds its causal pathways downward like tree roots using logic symbols (AND gates, OR gates) to identify root causes.
品質マネジメントシステム(QMS)の国際規格「ISO 9000シリーズ」は、基本・用語の「ISO 9000」、認証要求事項「ISO 9001」、持続的成功の指針「ISO 9004」から成ります。現行「ISO 9001:2015」では、「組織の状況」「リスク及び機会への取組み」「文書化した情報」が重視されます。
Meanwhile, the international standard family for Quality Management Systems (QMS)—the ISO 9000 Series—consists of ISO 9000 (fundamentals and vocabulary), ISO 9001 (requirements used for third-party certification), and ISO 9004 (guidelines for sustained success). In particular, the current ISO 9001:2015 edition emphasizes understanding the Context of the Organization, Actions to Address Risks and Opportunities, and managing Documented Information (integrating procedures and records).
ISO 9000シリーズが掲げる「品質マネジメントの7原則」は、①顧客重視、②リーダーシップ、③人々の積極的参加、④プロセスアプローチ、⑤改善、⑥客観的事実(エビデンス)に基づく意思決定、⑦関係性管理です。
The 7 Quality Management Principles set forth in the ISO 9000 series are: (1) Customer focus, (2) Leadership, (3) Engagement of people, (4) Process approach, (5) Improvement, (6) Evidence-based decision making, and (7) Relationship management.
Key points
- FMEA(故障モード影響解析)=部品の故障から全体への影響を積み上げる「ボトムアップ手法」/FTA(故障の木解析)=頂上事象から原因を掘り下げる「トップダウン手法」。
FMEA (Failure Mode and Effects Analysis) = Bottom-Up Method building upward from component failures to system-wide effects / FTA (Fault Tree Analysis) = Top-Down Method drilling downward from a Top Event into causes. - ISO 9001=品質マネジメントシステムの「要求事項」であり、7原則(顧客重視・リーダーシップ・プロセスアプローチ等)に基づく。
ISO 9001 = specifies the Requirements of a Quality Management System, grounded in the 7 Principles (Customer focus, Leadership, Process approach, etc.). - ISO 9001:2015の重要概念:「組織の状況」の把握、「リスク及び機会への取組み(未然防止)」、「文書化した情報」の維持・保持。
Key concepts of ISO 9001:2015: Understanding the Context of the Organization, Actions to Address Risks and Opportunities (prevention), and maintaining/retaining Documented Information.
| Word | Meaning |
|---|---|
| FMEA(ボトムアップ)とFTA(トップダウン) | FMEA (bottom-up) and FTA (top-down) |
| ISO 9001(品質マネジメントシステム要求事項) | ISO 9001 (Quality Management System requirements) |
| リスク及び機会への取組み・文書化した情報 | Actions to address risks and opportunities, Documented information |
| 品質マネジメントの7原則 | 7 Quality Management Principles |
試験によく出るポイントと覚え方
High-Frequency Exam Points and Memory Aids
第5章(問26〜問29)では、まず「4つの品質(要求品質→設計品質[ねらい]→製造品質[できばえ]→保証品質)」の定義と、5個のデータから「平均値・中央値(メディアン)・範囲R・不偏分散V(偏差平方和Sをn-1で割る)」を求める計算問題が定番です。
In Chapter 5 (Questions 26 to 29), definitions of the 4 Qualities (Required → Design → Manufacturing → Guaranteed) and calculation problems finding the Mean, Median, Range R, and Unbiased Variance V (dividing sum of squares S by n - 1) from 5 data points are exam staples.
データの分類では「計量値=正規分布」と「計数値(不良品数=二項分布、傷・欠点数=ポアソン分布)」、またQC七つ道具ではヒストグラムの形状(絶壁型・二山型・櫛歯型)と管理図の「±3σ・限界内でも連や傾向があれば異常」が頻出です。
For data classification, Continuous Data = Normal Distribution and Discrete Data (defectives = Binomial Distribution, scratches/defects = Poisson Distribution) appear frequently, as do Histogram shapes (cliff-like, twin-peak, comb-shaped) and Control Chart rules (±3σ limits, and Runs or Trends within limits indicating abnormality).
抜取検査の「生産者危険α(あわてもの=良いロットを不合格)」と「消費者危険β(ぼんやりもの=悪いロットを合格)」、および「問題解決型QCストーリー(要因解析)」と「課題達成型QCストーリー(攻めどころの選定・方策検討)」の違いもよく問われます。
The distinction between Producer's Risk α (hasty error = rejecting a good lot) and Consumer's Risk β (careless error = accepting a bad lot) in sampling inspection, as well as Problem-Solving QC Story (cause analysis) vs Task-Achieving QC Story (selecting attack points and studying measures), are also frequently tested.
さらにPL法で被害者が立証すべき3要件(①欠陥、②損害、③因果関係 ※過失の証明は不要)と、ISO 9001:2015のキーワード(リスク及び機会への取組み・文書化した情報)をセットで押さえましょう。
Furthermore, master the 3 elements a victim must prove under the PL Law ((1) Defect, (2) Damage, (3) Causal relationship—proving negligence is unnecessary) alongside ISO 9001:2015 keywords (Actions to address risks and opportunities, Documented information).
Key points
- 4つの品質(要求→設計→製造→保証)、計量値(正規分布)と計数値(不良数=二項分布・欠点数=ポアソン分布)、不偏分散V=S÷(n-1)。
4 Qualities (Required → Design → Manufacturing → Guaranteed), Continuous Data (Normal) & Discrete Data (defectives = Binomial, defects = Poisson), Unbiased Variance V = S ÷ (n - 1). - 問題解決型(要因解析で真因除去)vs 課題達成型(攻めどころ選定と方策追求)、生産者危険α(良いロットを不合格)vs 消費者危険β(悪いロットを合格)。
Problem-Solving type (cause analysis to remove root cause) vs Task-Achieving type (selecting attack points & pursuing measures); Producer's Risk α (rejecting good lot) vs Consumer's Risk β (accepting bad lot). - PL法の立証3要件=「欠陥・損害・因果関係(無過失責任)」、ISO 9001:2015=「リスク及び機会・文書化した情報」。
PL Law's 3 proof requirements = Defect, Damage, Causal relationship (strict no-fault liability); ISO 9001:2015 = Risks and opportunities, Documented information.
| Word | Meaning |
|---|---|
| 4つの品質と不偏分散(S÷(n-1)) | Four Qualities and Unbiased Variance (S ÷ (n - 1)) |
| 問題解決型と課題達成型QCストーリー | Problem-Solving and Task-Achieving QC Stories |
| 生産者危険αと消費者危険β | Producer's Risk α and Consumer's Risk β |
| PL法の立証3要件とISO 9001:2015 | 3 Proof Requirements of the PL Law and ISO 9001:2015 |
Quality Control (QC7, Sampling, ISO 9001)
Practice this chapter in the appOfficial references
- 中央職業能力開発協会(JAVADA) ビジネス・キャリア検定試験 3級 生産管理プランニング 試験範囲 — https://www.javada.or.jp/jigyou/gino/business/subject.html
- 中央職業能力開発協会 編『ビジネス・キャリア検定試験 標準テキスト【共通知識】生産管理 3級〔第4版〕』 — https://www.javada.or.jp/jigyou/gino/business/text.html