
Work Study (IE), Process Organization & Line Balancing (Process Analysis, Standard Time, Line Efficiency)
作業研究(IE)と工程編成・ラインバランシング(工程分析・標準時間・編成効率)
Production Management Planning Grade 3 生産管理プランニング (BC検定) · ビジネス・キャリア検定 生産管理プランニング3級 · Written by Tokutei Pass based on the official study texts; not copied verbatim.
1. IE(インダストリアル・エンジニアリング)の体系(テイラーとギルブレス・3S・ECRS・5W1H)
1. System of IE (Industrial Engineering) (Taylor & Gilbreth, 3Ss, ECRS, 5W1H)
「IE(Industrial Engineering:生産工学・作業研究)」は、現場の作業や工程を科学的に分析してムダをなくし、最良の作業方法と標準時間を確立する技術です。IEは作業のやり方を改善する「方法研究」と、作業時間を測る「作業測定」の2本柱から成ります。
IE (Industrial Engineering / Work Study) is a technology that scientifically analyzes shop-floor operations and processes to eliminate waste and establish the best work methods and standard times. IE consists of two pillars: Method Study (improving how work is done) and Work Measurement (measuring work time).
歴史的には、アメリカの「F.W.テイラー」がストップウォッチを用いた「時間研究(課業管理・科学的管理法)」を創始し、「ギルブレス夫妻」がレンガ積み作業の観察から「動作研究(サーブリッグ分析)」を創始しました。
Historically, F.W. Taylor in the United States founded Time Study using a stopwatch (task management / Scientific Management), while Frank and Lillian Gilbreth founded Motion Study (Therblig analysis) from observing bricklaying operations.
経営や生産を合理化する基本原則である「管理の3S」とは、複雑な作業や部品を減らす「単純化(Simplification)」、ルールや規格を統一する「標準化(Standardization)」、特定分野に機能を特化させる「専門化(Specialization)」の3つです(整理・整頓・清掃の現場3Sと区別します)。
The fundamental principles for rationalizing management and production—the 3Ss of Management—are Simplification (reducing complex tasks and parts), Standardization (unifying rules and specifications), and Specialization (concentrating functions in specific areas) (distinguished from the shop-floor 3Ss: Sort, Set in order, Shine).
また工程や作業を改善する際には、5W1H(なぜ・何を・どこで・いつ・誰が・どのように)で疑問を投げかけ、「ECRS(イクルス)の4原則」すなわち①排除(Eliminate:やめる)→②結合(Combine:まとめる)→③交換(Rearrange:順序を変える)→④簡素化(Simplify:簡単にする)の順で検討します。
When improving processes and operations, questions are posed using 5W1H (Why, What, Where, When, Who, How) and examined in the order of the 4 Principles of ECRS: (1) Eliminate (stop doing it) → (2) Combine (merge together) → (3) Rearrange (change the sequence) → (4) Simplify (make it easier).
Key points
- IEの2大源流:テイラー=「時間研究(科学的管理法)」、ギルブレス=「動作研究(サーブリッグ分析)」。
Two major origins of IE: Taylor = Time Study (Scientific Management), Gilbreth = Motion Study (Therblig analysis). - 合理化(管理)の3S:単純化(Simplification)・標準化(Standardization)・専門化(Specialization)。
3Ss of rationalization (management): Simplification, Standardization, Specialization. - 改善の4原則(ECRS):①排除(E:なくせないか)→②結合(C:一緒にできないか)→③交換(R:順序を変えられないか)→④簡素化(S:楽にできないか)。
Four principles of improvement (ECRS): (1) Eliminate (E: can it be removed?) → (2) Combine (C: can it be done together?) → (3) Rearrange (R: can the order be changed?) → (4) Simplify (S: can it be made easier?).
| Word | Meaning |
|---|---|
| テイラーの時間研究とギルブレスの動作研究 | Taylor's Time Study and Gilbreth's Motion Study |
| 管理の3S(単純化・標準化・専門化) | 3Ss of Management (Simplification, Standardization, Specialization) |
| 改善のECRS(排除・結合・交換・簡素化)と5W1H | ECRS Principles of Improvement (Eliminate, Combine, Rearrange, Simplify) and 5W1H |
2. 方法研究①:動作分析(サーブリッグ18基本動作の3分類と動作経済の4原則)
2. Method Study (1): Motion Analysis (3 Categories of 18 Basic Therbligs and 4 Principles of Motion Economy)
「動作分析」は、作業者の手足や目の細かい動きを分析してムダな動作や疲労を除く手法です。ギルブレスが考案した「サーブリッグ分析」では、人間の作業動作を18種類の基本動作(動素)に分解し、第1類〜第3類に分類します。
Motion analysis is a method of analyzing fine movements of a worker's hands, feet, and eyes to eliminate wasteful motions and fatigue. In Therblig analysis devised by Gilbreth, human work motions are broken down into 18 basic motions (therbligs) and classified into Category 1 through Category 3.
「第1類(有効動作)」は、作業を進めるのに直接必要な動作(空手移動・つかむ・荷重移動・組み合わせる・使う・放す等)であり、動作距離の短縮などで簡素化を図ります。
Category 1 (Effective motions) are motions directly necessary to advance the work (transport empty, grasp, transport loaded, assemble, use, release load, etc.), which are simplified by shortening motion distances.
「第2類(補助動作・遅れ動作)」は、探す・選ぶ・考える・位置決めする・検査するなど第1類を遅らせる思考的な動作であり、定位置管理や治具の工夫で極力排除します。「第3類(無益動作)」は、保持する(片手で持ち続ける)・手待ち・休むなど作業を全く進めない動作であり、固定治具等で徹底的に排除します。
Category 2 (Auxiliary / delaying motions) are mental or search motions that delay Category 1—such as search, select, plan/think, position, and inspect—which are eliminated as much as possible through fixed-location storage and jigs. Category 3 (Non-effective / wasteful motions) are motions that do not advance the work at all—such as hold (holding an object with one hand), avoidable/unavoidable delay, and rest—which must be thoroughly eliminated using holding jigs.
さらに疲労が少なく能率的な動作を実現する指針が「動作経済の原則(4大原則)」であり、①両手を同時に対称的に使う、②基本動作の数を最小にし移動距離を最短にする、③重力や動力を利用して楽な動作にする、④材料や工具を正常作業域の定位置に置く、を定めています。
Furthermore, guidelines for achieving low-fatigue, efficient motion are the Principles of Motion Economy (4 major principles): (1) Use both hands simultaneously and symmetrically, (2) Minimize the number of basic motions and shorten travel distance, (3) Use gravity and mechanical power for effortless motion, and (4) Place materials and tools in fixed locations within the normal working area.
Key points
- サーブリッグ第1類=作業を行うのに必要な有効動作(つかむ・運ぶ・組む・使う等)。
Therblig Category 1 = Effective motions necessary to perform work (grasp, transport, assemble, use, etc.). - 第2類=作業を遅らせる思考・探索動作(探す・選ぶ・位置決めする等)→置き場固定や治具化で排除。
Category 2 = Mental/search motions that delay work (search, select, position, etc.) → Eliminate via fixed locations and jigs. - 第3類=作業を全く進めない無益な動作(保持・手待ち・避けられない遅れ等)→最優先で排除。
Category 3 = Non-effective motions that do not advance work at all (hold, waiting/delay, etc.) → Top priority for elimination. - 動作経済の4原則:①両手の同時使用(片手保持の禁止)、②動作数の削減と距離最短化、③楽な動作(重力・治具の活用)、④材料・工具の定位置化。
Four Principles of Motion Economy: (1) Simultaneous use of both hands (no one-hand holding), (2) Fewer motions & shortest distance, (3) Effortless motion (use gravity/jigs), (4) Fixed locations for materials and tools.
| Word | Meaning |
|---|---|
| サーブリッグ分析(18基本動作:第1類・第2類・第3類) | Therblig Analysis (18 basic motions: Category 1, Category 2, Category 3) |
| 動作経済の4原則と正常作業域 | Four Principles of Motion Economy and Normal working area |
| PTS法(既定時間標準法)と微動作研究 | PTS (Predetermined Time Standard) method and Micromotion study |
3. 方法研究②:工程分析とJIS工程図記号(加工・運搬・貯蔵と滞留・検査・補助記号)
3. Method Study (2): Process Analysis and JIS Process Chart Symbols (Operation, Transport, Storage vs Delay, Inspection, Auxiliary Symbols)
「工程分析」は、原材料が投入されてから完成品になるまでの工程全体の流れを、JIS規格(JIS Z 8206)の「工程図記号」で図表化して改善する手法です。対象により、モノの流れを追う「製品工程分析」、人の動きを追う「作業者工程分析」、人と機械の協調を分析する「連合作業分析(マン・マシンチャート)」があります。
Process analysis charts and improves the overall flow of processes from raw material input to finished product using JIS standard (JIS Z 8206) Process Chart Symbols. Depending on the subject, there are Product process analysis (following material flow), Operator process analysis (following worker movement), and Combined work analysis (Man-Machine chart analyzing human-machine coordination).
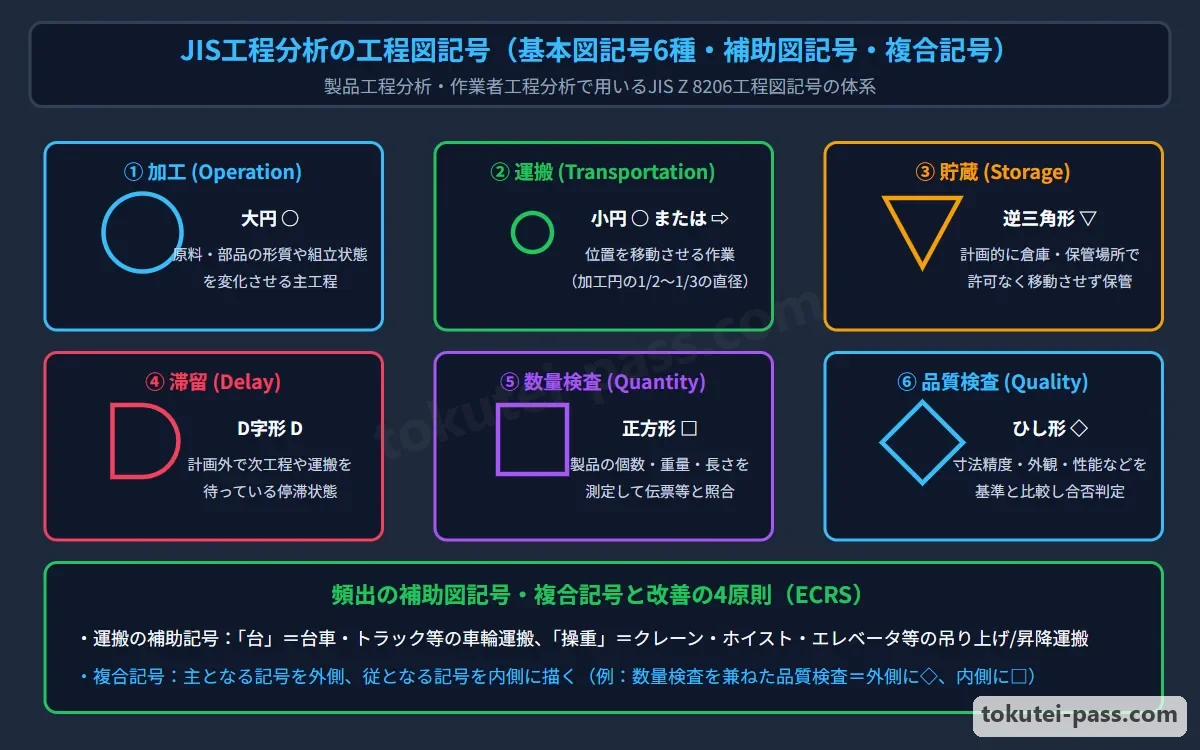
JISの基本図記号は4要素6記号です。①「加工」は大きな丸「○」(形や性質を変える・組み立てる)、②「運搬」は矢印「⇨」または小さな丸「○」(位置を変える)で表します。
There are 6 basic JIS chart symbols across 4 elements: (1) Operation (processing/assembly changing shape or properties) is a large circle ○; (2) Transport (changing location) is an arrow ⇨ or a small circle ○.
③「停滞」は2つに区別します。計画的に倉庫等に保管する「貯蔵」は逆三角形「▽」、工程間で計画外に待たされている状態の「滞留」はアルファベットのD形「D」で表します。④「検査」も2つに分かれ、個数や重さを測る「数量検査」は四角形「□」、良品か不良品かを判定する「品質検査」はひし形「◇」です。
(3) Retention (non-movement) is distinguished into two symbols: Storage (planned keeping in a warehouse, etc.) is an inverted triangle ▽, whereas Delay (unplanned waiting between processes) is a D-shape D. (4) Inspection is also divided into two: Quantity inspection (measuring count or weight) is a square □, and Quality inspection (judging good vs defective) is a diamond ◇.
さらに複合記号(例:品質検査を主としつつ数量検査も行う場合は外側に◇・内側に□を描く)や、運搬手段などを文字で示す「補助記号」があります。特に台車・トラックによる運搬を示す「台」、クレーン・ホイスト等の揚重機による運搬を示す「操重」が試験で頻出です。
There are also combined symbols (e.g., primarily performing quality inspection while also checking quantity is drawn with an outer diamond ◇ and inner square □) and Auxiliary symbols indicating transport means by text. Exams frequently test '台' (handcart / truck transport) and '操重' (crane / hoist lifting transport).
Key points
- JIS基本工程図記号:加工=「○」、運搬=「⇨(または小○)」、貯蔵(計画保管)=「▽」、滞留(工程間の待ち)=「D」、数量検査=「□」、品質検査=「◇」。
Basic JIS process chart symbols: Operation = ○, Transport = ⇨ (or small ○), Storage (planned storage) = ▽, Delay (unplanned waiting) = D, Quantity inspection = □, Quality inspection = ◇. - 複合記号のルール:2つの機能を同時に行うときは、「主たる工程の記号を外側」に、「従たる工程の記号を内側」に描く。
Combined symbol rule: When performing two functions simultaneously, draw the primary process symbol on the outside and the secondary process symbol on the inside. - 運搬の補助記号:「人(人力)」「台(台車・トラック)」「コン(コンベヤ)」「操重(クレーン・ホイスト)」「自(シュート等の自重落下)」。
Auxiliary transport symbols: 人 (manual), 台 (cart / truck), コン (conveyor), 操重 (crane / hoist), 自 (gravity chute drop).
| Word | Meaning |
|---|---|
| 製品工程分析・作業者工程分析・連合作業分析 | Product process analysis, Operator process analysis, Combined work analysis |
| JIS工程図記号(加工○・運搬⇨・貯蔵▽・滞留D・数量検査□・品質検査◇) | JIS process chart symbols (Operation ○, Transport ⇨, Storage ▽, Delay D, Quantity □, Quality ◇) |
| 補助記号(台:台車・操重:クレーンやホイスト) | Auxiliary symbols (台: Cart/Truck, 操重: Crane/Hoist) |
4. 作業測定①:稼働分析(連続観測法とワークサンプリング法・必要観測数Nの計算)
4. Work Measurement (1): Operating Analysis (Continuous Observation vs Work Sampling & Required Observations N)
「稼働分析」とは、作業者や機械設備が1日の就業時間のうち「どのくらいの割合で主体作業(稼働)を行い、どのくらいの割合で準備・余裕・手待ち(非稼働)が生じているか」の稼働率や時間構成比率を調査する手法です。
Operating analysis (work sampling / ratio delay study) investigates the operating ratio and time composition proportions—what percentage of daily working hours workers or machines spend on main productive work (operating) versus setup, allowances, and waiting (non-operating).
手法には、1人の観測者が対象に付きっきりで長時間記録し続ける「連続観測法」と、ランダムな時刻に職場を巡回してその瞬間の稼働・非稼働の回数だけを数え、統計的(二項分布)に稼働率を推定する「ワークサンプリング法(瞬間観測法)」があります。
Methods include Continuous observation (one observer stays with the subject continuously recording over a long period) and Work Sampling (instantaneous observation: patrolling the shop at random times, counting only the frequency of operating vs non-operating states at those instants, and statistically estimating the operating ratio via the binomial distribution).
ワークサンプリング法は、1人の観測者が多くの作業者や機械を同時に調査でき、ストップウォッチが不要で被観測者に心理的圧迫感を与えないという優れた特徴を持ちます。
Work Sampling has the advantages that a single observer can survey many workers or machines simultaneously, no stopwatch is needed, and subjects feel no psychological pressure.
信頼度95%(正規分布係数2)で、事象の発生比率(稼働率)をp、許容「絶対誤差」をEとするとき、必要観測回数Nは「N = 4 × p × (1 - p) ÷ E²」で求めます(許容「相対誤差」Sが与えられたときは E = S × p を代入し「N = 4 × (1 - p) ÷ (S² × p)」となります)。
At a 95% confidence level (normal distribution factor of 2), where p is the occurrence ratio (operating ratio) of the target event and E is the allowable Absolute Error, the required number of observations N is calculated as: N = 4 × p × (1 - p) ÷ E² (when allowable Relative Error S is given, substituting E = S × p yields N = 4 × (1 - p) ÷ (S² × p)).
Key points
- ワークサンプリング法(瞬間観測法)=ランダムな時点での瞬間観測回数から統計的に稼働率や余裕率を求める手法(多数の対象を1人で同時に観測可能)。
Work Sampling (instantaneous observation) = Statistically estimates operating and allowance ratios from instantaneous observation counts at random times (one person can observe many subjects simultaneously). - 必要観測数N(信頼度95%・絶対誤差E):N = 4 × p × (1 - p) ÷ E²。
Required observations N (95% confidence, absolute error E): N = 4 × p × (1 - p) ÷ E². - 必要観測数N(信頼度95%・相対誤差S):N = 4 × (1 - p) ÷ (S² × p)(※E = S × p の関係)。
Required observations N (95% confidence, relative error S): N = 4 × (1 - p) ÷ (S² × p) (since E = S × p). - 【例】総観測回数500回のうち稼働観測300回 → 推定稼働率p=300÷500=0.60(60%)。この稼働率p=0.60を信頼度95%・許容絶対誤差E=0.04(4%)で求める必要観測数N=4×0.60×(1-0.60)÷(0.04)²=0.96÷0.0016=600回
Example: Out of 500 total observations, 300 are operating → Estimated operating ratio p = 300 ÷ 500 = 0.60 (60%). To estimate p = 0.60 at 95% confidence within an allowable absolute error E = 0.04 (4%), required observations N = 4 × 0.60 × (1 - 0.60) ÷ (0.04)² = 0.96 ÷ 0.0016 = 600 observations
| Word | Meaning |
|---|---|
| 稼働分析(連続観測法とワークサンプリング法) | Operating analysis (Continuous observation method and Work Sampling method) |
| 必要観測数Nと絶対誤差E・相対誤差S | Required observations N, Absolute error E, and Relative error S |
| 稼働率と余裕率の推定 | Estimation of operating ratio and allowance ratio |
5. 作業測定②:時間研究の4M条件と標準時間(ST:レイティング・外掛け法と内掛け法)
5. Work Measurement (2): 4M Conditions of Time Study and Standard Time (ST: Rating, External vs Internal Allowance Methods)
「標準時間(ST:Standard Time)」とは、その仕事に適正を持ち習熟した作業者が、所定の作業条件のもとで、標準の作業速度(ペース)で1単位の作業を遂行するのに必要な時間です。
Standard Time (ST) is the time required for a qualified, well-trained worker to complete one unit of work at a standard work pace under specified working conditions.
時間研究を行う前提として、①使用する「材料(Material)」、②「機械・設備・治工具(Machine)」、③作業手順や「作業方法(Method)」、④資格や熟練度などの「作業者(Man)」という「4M条件」が標準化されていなければなりません(※「士気(Morale)」は4Mに含まれません)。
As a prerequisite for conducting time study, the 4M Conditions must be standardized: (1) Material used, (2) Machine / equipment / jigs used, (3) working procedure or Method, and (4) Man (worker qualifications and skill level) (Note: exam questions frequently include a trap option listing Morale as one of the 4M conditions).
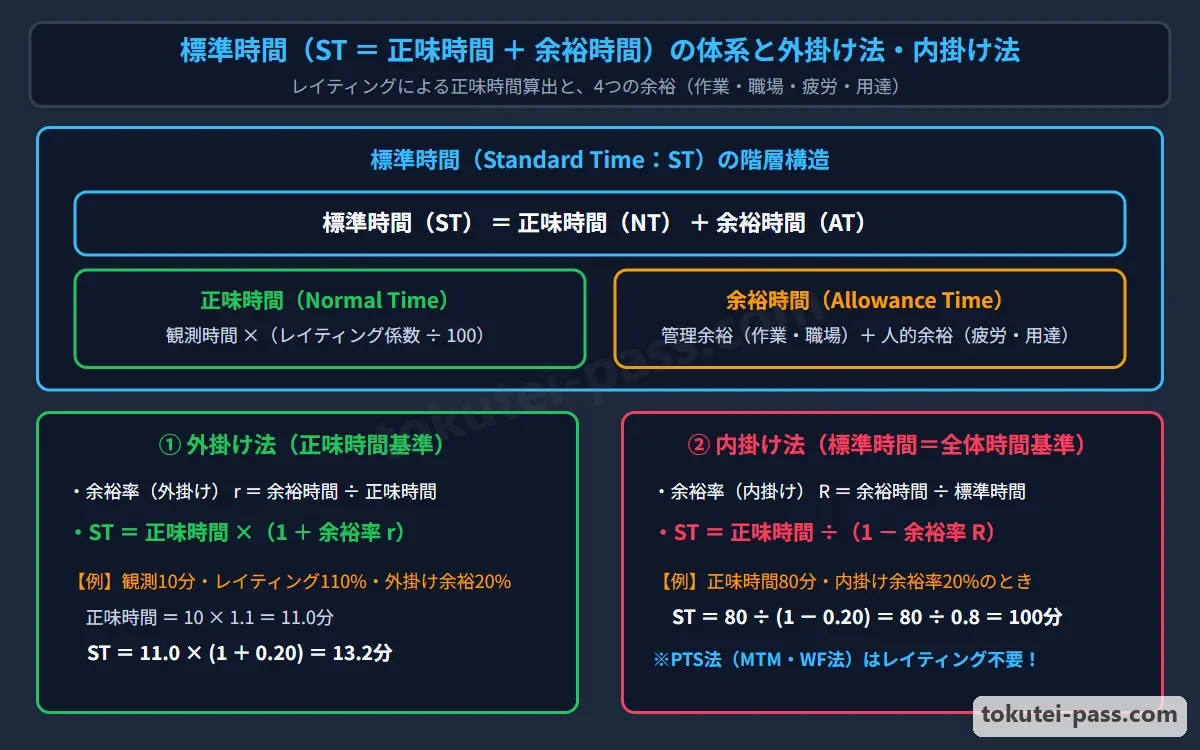
標準時間は「正味時間(主作業時間+準備段取り時間)」と「余裕時間(用達余裕・疲労余裕・作業余裕・職場余裕)」の合計です。ストップウォッチで測った「観測時間」に、作業ペースを補正する「レイティング係数(標準速度に対する比率)」を掛けて「正味時間」を求めます。
Standard Time is the sum of Net Time (normal time: main operation time + setup time) and Allowance Time (personal allowance, fatigue allowance, operation allowance, shop allowance). Multiplying the Observed Time measured by stopwatch by a Rating Factor (ratio correcting the observed pace to standard pace) gives the Net Time.
正味時間から標準時間を求める計算には、余裕率(外掛け余裕率=余裕時間÷正味時間)を用いる「外掛け法:標準時間 = 正味時間 × (1 + 余裕率)」と、内掛け余裕率(=余裕時間÷標準時間)を用いる「内掛け法:標準時間 = 正味時間 ÷ (1 - 余裕率)」があります。
To calculate Standard Time from Net Time, there are two methods: the External Allowance Method (where allowance ratio = allowance time ÷ net time) using ST = Net time × (1 + Allowance ratio); and the Internal Allowance Method (where allowance ratio = allowance time ÷ standard time) using ST = Net time ÷ (1 - Allowance ratio).
Key points
- 作業測定(標準時間設定)の前提となる4M条件=材料(Material)・機械設備(Machine)・作業方法(Method)・作業者(Man)。※士気(Morale)は含まない。
4M Conditions required for work measurement (setting Standard Time) = Material, Machine, Method, and Man. Note: Morale is NOT included. - 正味時間 = 観測時間 × レイティング係数(例:110%なら×1.10)。
Net Time (Normal Time) = Observed Time × Rating Factor (e.g., × 1.10 for 110%). - 標準時間の算定:外掛け法「ST = 正味時間 × (1 + 余裕率)」、内掛け法「ST = 正味時間 ÷ (1 - 余裕率)」。
Standard Time calculation: External method 'ST = Net time × (1 + Allowance ratio)', Internal method 'ST = Net time ÷ (1 - Allowance ratio)'. - 【例】観測時間15分・レイティング係数120% → 正味時間=15×1.20=18分。余裕率10%のとき、外掛け法なら標準時間=18×(1+0.10)=19.8分、内掛け法なら標準時間=18÷(1-0.10)=20.0分
Example: Observed time 15 min, rating factor 120% → Net time = 15 × 1.20 = 18 min. With a 10% allowance ratio, External method gives Standard Time = 18 × (1 + 0.10) = 19.8 min; Internal method gives Standard Time = 18 ÷ (1 - 0.10) = 20.0 min
| Word | Meaning |
|---|---|
| 標準時間(ST=正味時間+余裕時間)と4M条件 | Standard Time (ST = Net time + Allowance time) and 4M Conditions |
| レイティング(作業速度の評価補正) | Rating (evaluating and adjusting work pace) |
| 外掛け法と内掛け法・人的余裕(疲労・用達余裕) | External allowance method, Internal allowance method, and Personal allowances (fatigue, personal needs) |
6. 工程編成の3ステップ(工程設計→作業設計→物流レイアウト設計)とライン移動方式
6. 3 Steps of Process Organization (Process Design → Operation Design → Logistics & Layout Design) and Line Transfer Methods
製品の設計図面を受けて、実際に工場で効率よく生産できる工程システムを組み立てる「工程編成」は、「①工程設計」→「②作業設計」→「③工程間物流およびレイアウト設計」の3ステップの順序で進められます。
Receiving product design drawings and building an efficient factory production process system—Process Organization—proceeds in a three-step sequence: (1) Process Design → (2) Operation (Job) Design → (3) Inter-process Logistics and Layout Design.
「①工程設計」では、図面や部品表から必要な加工・組立技術を選定し、内外作区分・使用設備・加工順序(工程フロー)を決定します。続く「②作業設計」では、各作業ステーションへの要素作業の割り付け(ラインバランシング)や具体的な作業手順・治工具・標準時間を設定します。
In (1) Process Design, engineers select required machining and assembly technologies from drawings and BOMs, deciding make-or-buy classifications, equipment to use, and processing sequences (process flow). Next, in (2) Operation Design, work elements are assigned to workstations (line balancing) and specific work procedures, jigs/tools, and standard times are set.
そして「③工程間物流およびレイアウト設計」では、工程間での運搬方法(マテハン機器)と工場床面上への機械・作業台・通路の配置(レイアウト)を決定します。
Then, in (3) Inter-process Logistics and Layout Design, transport methods between processes (material handling equipment) and the physical floor arrangement (layout) of machines, workbenches, and aisles are determined.
またライン生産における品物の移動方式には、①作業終了ごとに手やコロコンベヤで次工程へ送る「手送り方式」、②コンベヤで運び作業中は品物を止める「コンベヤ静止作業方式」、③一定速度で動くコンベヤ上で作業する「コンベヤ移動作業方式」、④一定時間(タクト)ごとに全工程一斉に品物を1工程ずつ進める「タクト方式」があります。
Item transfer methods on production lines include four types: (1) Manual transfer (pushing items by hand or roller conveyor to the next station upon finishing each task); (2) Conveyor stationary-work method (conveyor transports the item, which stops during the operation); (3) Conveyor moving-work method (working on the item while the conveyor moves at constant speed); and (4) Takt method (advancing items at all stations simultaneously by one station at fixed takt intervals).
Key points
- 工程編成の3ステップの順序:①工程設計(加工法と工程順序の決定)→②作業設計(各職場・作業者の作業内容の決定)→③工程間物流およびレイアウト設計。
Sequence of the 3 steps of Process Organization: (1) Process Design (deciding processing methods and sequence) → (2) Operation Design (deciding work content for each station/worker) → (3) Inter-process Logistics and Layout Design. - ラインの品物移動方式:手送り方式・コンベヤ静止作業方式・コンベヤ移動作業方式・タクト方式(間欠移動方式)。
Line item transfer methods: Manual transfer, Conveyor stationary-work method, Conveyor moving-work method, and Takt method (intermittent simultaneous indexing). - タクト方式=定められたサイクルタイム(タクトタイム)ごとに、全ステーションの仕掛品を一斉に次工程へ移動させる方式。
Takt method = Moving work-in-process at all workstations simultaneously to the next process at every fixed cycle time (takt time).
| Word | Meaning |
|---|---|
| 工程編成の3ステップ(工程設計→作業設計→物流レイアウト設計) | Three steps of Process Organization (Process Design → Operation Design → Logistics & Layout Design) |
| コンベヤ静止作業方式とコンベヤ移動作業方式 | Conveyor stationary-work method and Conveyor moving-work method |
| 手送り方式とタクト方式 | Manual transfer method and Takt method |
7. サイクルタイム(ピッチタイム)と最小作業ステーション数の計算(不適合品率の考慮)
7. Calculating Cycle Time (Pitch Time) and Minimum Number of Workstations (Accounting for Defect Rate)
ライン生産において、最終工程から完成品が1個ずつ生み出される時間間隔(各作業ステーションに許容される最大持ち時間)を「サイクルタイム(CT:ピッチタイムまたはタクトタイム)」と呼びます。
In line production, the time interval at which finished units emerge one by one from the final process (the maximum time allowed at each workstation) is called Cycle Time (CT: pitch time or takt time).
基本のサイクルタイムは「サイクルタイムCT = 1日(または期間)の稼働可能時間 ÷ 必要生産数量」で計算します。もしラインで不適合品率(不良率)rが見込まれる場合は、必要良品数を適合品率(1-r)で割った投入数を流す必要があるため、「CT = 稼働可能時間 × (1 - 不適合品率r) ÷ 必要良品数」となります。
Basic cycle time is calculated as: Cycle Time CT = Daily (or period) available operating time ÷ Required production quantity. If a non-conforming (defect) rate r is expected on the line, the input quantity must equal required good units divided by the conforming rate (1 - r), so CT = Available operating time × (1 - Defect rate r) ÷ Required good units.
また、製品1個を完成させるための全要素作業時間の合計(総作業時間 ∑ti)をサイクルタイムCTで割ることで、その生産量を達成するのに最低限必要な「理論最小作業ステーション数(最小工程数)」が求まります。
Dividing the sum of all elemental task times needed to complete one product (total work time ∑ti) by Cycle Time CT gives the Theoretical Minimum Number of Workstations (minimum number of processes) needed to achieve that production volume.
計算式は「理論最小ステーション数 = 総作業時間 ∑ti ÷ サイクルタイムCT」であり、計算結果に小数(端数)が出た場合は、必ず小数点以下を「切り上げ」て整数のステーション数とします。
The formula is: Theoretical Minimum Workstations = Total work time ∑ti ÷ Cycle Time CT; if the division yields a decimal fraction, you must always round UP to the next whole integer number of stations.
Key points
- 基本サイクルタイムCT = 稼働可能時間 ÷ 必要生産量。
Basic Cycle Time CT = Available operating time ÷ Required production volume. - 不適合品率rを考慮したサイクルタイムCT = 稼働可能時間 × (1 - r) ÷ 必要良品数(※不良が出る分だけ1個あたりピッチを速くする必要がある)。
Cycle Time accounting for defect rate r: CT = Available operating time × (1 - r) ÷ Required good units (because defects occur, the pitch per unit must be faster). - 理論最小ステーション数 = 総作業時間 ÷ サイクルタイムCT(※端数は必ず切り上げる)。
Theoretical Minimum Workstations = Total work time ÷ Cycle Time CT (always round any fraction UP). - 【例】1日の稼働時間450分(27,000秒)・1日の必要良品数480個・不適合品率4%(適合品率0.96) → 必要投入数=480÷0.96=500個、サイクルタイムCT=27,000÷500=54秒/個。製品1個の総作業時間が240秒なら最小ステーション数=240÷54=4.44… → 切り上げて5ステーション
Example: Daily operating time 450 min (27,000 sec), required daily good units 480, defect rate 4% (conforming rate 0.96) → Required input quantity = 480 ÷ 0.96 = 500 units, Cycle Time CT = 27,000 ÷ 500 = 54 sec/unit. If total work time per product is 240 sec, minimum stations = 240 ÷ 54 = 4.44... → Round up to 5 stations
| Word | Meaning |
|---|---|
| サイクルタイム(CT)・ピッチタイム・タクトタイム | Cycle Time (CT), Pitch Time, Takt Time |
| 不適合品率を見込んだサイクルタイム計算 | Cycle Time calculation accounting for defect rate |
| 理論最小ステーション数(端数切り上げ) | Theoretical minimum number of workstations (rounding fractions up) |
8. ラインバランシング(編成効率・バランスロス)と先行関係ネットワーク図(優先順位図)
8. Line Balancing (Line Efficiency, Balance Loss) and Precedence Network Diagrams
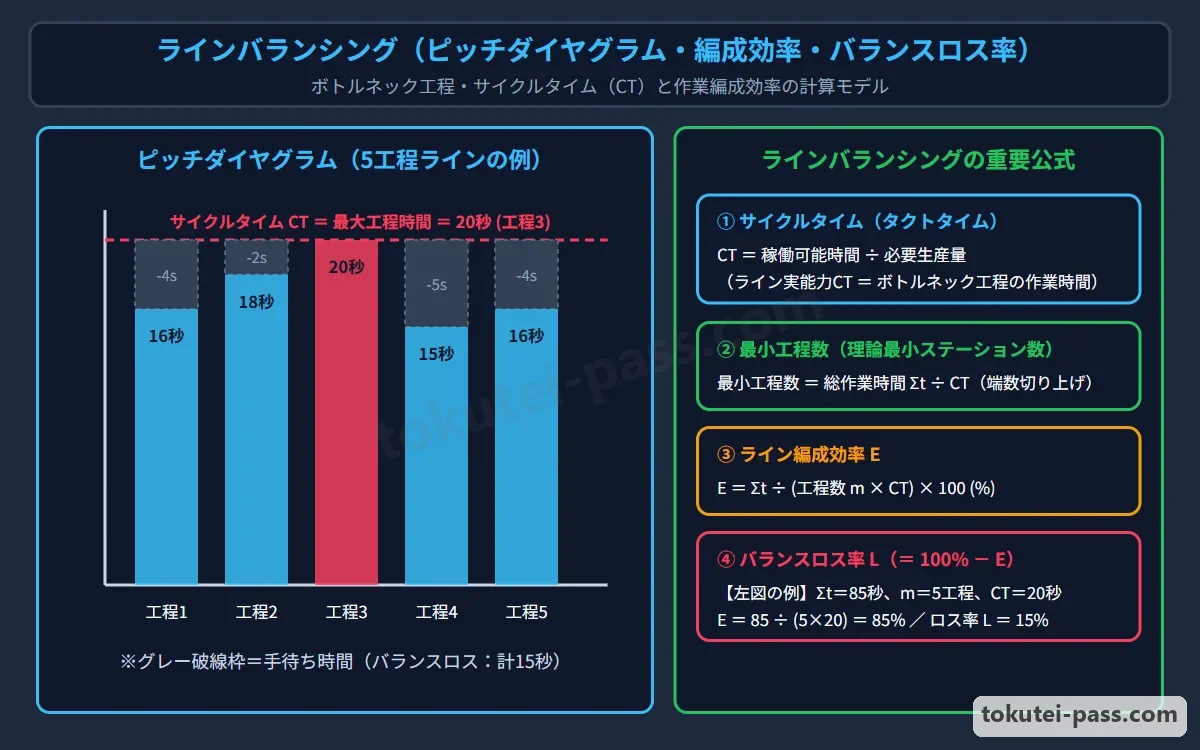
「ラインバランシング」とは、各作業ステーションに割り付けられた作業時間のばらつきをなくし、均等化することです。各工程の作業時間を棒グラフで並べた図を「ピッチダイヤグラム」と呼び、最も作業時間が長い工程(ボトルネック工程)がライン全体の実質サイクルタイムCTを決定します。
Line Balancing is eliminating variations and equalizing the operation times assigned to each workstation. A bar chart arranging the operation times of each station side by side is called a Pitch Diagram, where the station with the longest operation time (the bottleneck station) determines the effective Cycle Time CT of the entire line.
ラインの編成の良さを示す「編成効率(ラインバランス効率)」は、「編成効率 = 各ステーションの作業時間の合計∑ti ÷(ステーション数n × サイクルタイムCT[最大工程時間])× 100(%)」で求めます。
Line Efficiency (line balance efficiency), which measures how well the line is balanced, is calculated as: Line Efficiency = Sum of station work times ∑ti ÷ (Number of stations n × Cycle Time CT (maximum station time)) × 100 (%).
また手待ちロスの割合である「バランスロス率(編成ロス率)」は「100% - 編成効率(または 1 - 編成効率)」であり、正味作業時間に対する手待ち時間の比である「組余裕率」は「(n × CT - ∑ti)÷ ∑ti」で計算します。
The proportion of idle waiting loss—Balance Loss Rate (line balancing loss)—is 100% - Line Efficiency (or 1 - Line Efficiency); and the Team Allowance Ratio (ratio of total idle waiting time to total net work time) is calculated as: (n × CT - ∑ti) ÷ ∑ti.
なお要素作業の順序制約を示す「先行関係ネットワーク図(優先順位図)」から指定ステーション数nに割り付ける計算問題では、矢印の先行関係を崩さずに各ステーションの合計時間がなるべく均等になるよう要素作業をグループ化し、その中の「最大ステーション時間」が実現可能な「最小サイクルタイム」となります。
In calculation problems assigning work elements from a Precedence Network Diagram (priority diagram) into a specified number of stations n, group the work elements so that station total times are as equal as possible without violating the arrow precedence relations; the Maximum Station Time among the grouped stations becomes the achievable Minimum Cycle Time.
Key points
- 編成効率 = 総作業時間 ∑ti ÷(ステーション数 n × 最大作業時間 CT)。
Line Efficiency = Total work time ∑ti ÷ (Number of stations n × Maximum station work time CT). - バランスロス率 = 1 - 編成効率 = 1 - ∑ti ÷ (n × CT)。組余裕率 = (n × CT - ∑ti) ÷ ∑ti。
Balance Loss Rate = 1 - Line Efficiency = 1 - ∑ti ÷ (n × CT). Team Allowance Ratio = (n × CT - ∑ti) ÷ ∑ti. - 先行関係ネットワーク図(優先順位図)の割付=先行順序を守りつつ各ステーションの作業時間の最大値(ボトルネック)が最小になるように配分する。
Assignment using a Precedence Network Diagram = Allocate tasks while respecting precedence order so that the maximum station time (bottleneck) is minimized. - 【例】5つのステーションの作業時間が18秒・22秒・25秒・20秒・15秒(合計∑ti=100秒、ボトルネックCT=25秒) → 編成効率=100÷(5×25)=100÷125=0.80(80%)、バランスロス率=100%-80%=20%(組余裕率=(125-100)÷100=25%)
Example: Work times of 5 stations are 18 sec, 22 sec, 25 sec, 20 sec, 15 sec (total ∑ti = 100 sec, bottleneck CT = 25 sec) → Line Efficiency = 100 ÷ (5 × 25) = 100 ÷ 125 = 0.80 (80%), Balance Loss Rate = 100% - 80% = 20% (Team allowance ratio = (125 - 100) ÷ 100 = 25%)
| Word | Meaning |
|---|---|
| ラインバランシングとピッチダイヤグラム・ボトルネック工程 | Line Balancing, Pitch Diagram, and Bottleneck process |
| 編成効率・バランスロス率・組余裕率 | Line Efficiency, Balance Loss Rate, and Team Allowance Ratio |
| 先行関係ネットワーク図(優先順位図)と要素作業 | Precedence Network Diagram (Priority diagram) and Work elements |
試験によく出るポイントと覚え方
Frequent Exam Points and How to Remember Them
第4章(問19〜問25)では、まず「テイラー=時間研究・ギルブレス=動作研究(サーブリッグ)」「管理の3S(単純化・標準化・専門化)」「ECRS」および「サーブリッグの第1類(有効)・第2類(探す等の遅れ)・第3類(保持・手待ち等の無益動作)」が頻出です。
In Chapter 4 (Questions 19 to 25), exams frequently test: Taylor = Time Study, Gilbreth = Motion Study (Therbligs); the 3Ss of management (Simplification, Standardization, Specialization); ECRS; and the 3 Therblig categories (Category 1 effective, Category 2 delaying like search, Category 3 non-effective like hold and wait).
JIS工程図記号では、「貯蔵(▽:計画保管)と滞留(D:計画外の待ち)」「数量検査(□)と品質検査(◇)」、さらに補助記号の「台(台車・トラック)」と「操重(クレーン・ホイスト)」の組合わせが毎回のように出題されます。
In JIS process chart symbols, combinations distinguishing Storage (▽: planned storage) vs Delay (D: unplanned wait), Quantity inspection (□) vs Quality inspection (◇), and auxiliary symbols '台' (cart/truck) vs '操重' (crane/hoist) appear on nearly every exam.
作業測定では、時間研究の前提となる「4M条件(Material・Machine・Method・Man ※士気Moraleは含まない)」のひっかけと、ワークサンプリングの必要観測数N、および標準時間(レイティング・外掛け法・内掛け法)の計算を押さえましょう。
In work measurement, master the trap on the 4M Conditions for time study (Material, Machine, Method, Man—note that Morale is NOT included), the required observations N in Work Sampling, and Standard Time calculations (rating, external vs internal allowance methods).
工程編成では、「①工程設計→②作業設計→③工程間物流およびレイアウト設計」の順序、不適合品率を考慮したサイクルタイムと最小ステーション数(端数切り上げ)、編成効率とバランスロス率、および先行関係ネットワーク図からの最小サイクルタイム計算を必ず得点源にしてください。
In process organization, make sure to score points on: the sequence (1) Process Design → (2) Operation Design → (3) Inter-process Logistics & Layout Design; Cycle Time accounting for defect rate and minimum stations (round up); Line Efficiency & Balance Loss; and finding the minimum Cycle Time from a precedence network diagram.
Key points
- JIS工程図記号:加工○・運搬⇨・貯蔵▽・滞留D・数量検査□・品質検査◇、補助記号「台=台車」「操重=クレーン・ホイスト」。
JIS process chart symbols: Operation ○, Transport ⇨, Storage ▽, Delay D, Quantity inspection □, Quality inspection ◇; auxiliary symbols '台 = cart', '操重 = crane/hoist'. - 時間研究の4M条件に「Morale(士気)」は含まれない。工程編成は「①工程設計→②作業設計→③物流・レイアウト設計」の順。
The 4M conditions of time study do NOT include Morale. Process organization follows the order: (1) Process Design → (2) Operation Design → (3) Logistics & Layout Design. - ライン計算3点セット:①不適合品率を考慮したサイクルタイムと最小ステーション数、②編成効率とバランスロス率、③先行関係図からの最小サイクルタイム。
Three-part line calculation set: (1) Cycle time with defect rate & minimum stations, (2) Line efficiency & balance loss rate, (3) Minimum cycle time from a precedence network diagram.
| Word | Meaning |
|---|---|
| JIS工程図記号と補助記号(台・操重) | JIS Process Chart Symbols and Auxiliary Symbols (台, 操重) |
| 作業測定の4M条件とワークサンプリング | 4M Conditions of Work Measurement and Work Sampling |
| 編成効率・バランスロスと先行関係ネットワーク図 | Line Efficiency, Balance Loss, and Precedence Network Diagram |
Work Study (IE) & Line Balancing
Practice this chapter in the appOfficial references
- 中央職業能力開発協会(JAVADA) ビジネス・キャリア検定試験 3級 生産管理プランニング 試験範囲 — https://www.javada.or.jp/jigyou/gino/business/subject.html
- 中央職業能力開発協会 編『ビジネス・キャリア検定試験 標準テキスト【専門知識】生産管理プランニング 3級〔第4版〕』 — https://www.javada.or.jp/jigyou/gino/business/text.html